FxNews—US gasoline futures climbed to $2 per gallon, tracking oil prices higher after OPEC+ announced it would postpone a planned production increase by one month. OPEC had initially scheduled a 180,000 barrels-per-day rise for December.
Renewed tensions in the Middle East further boosted energy-related commodities. Furthermore, in the US, the latest Energy Information Administration data indicated a slight rise in gas demand to 9.15 million barrels per day. In comparison, gasoline inventories declined to 210.9 million barrels amid lower production levels.
Gasoline Analysis – 5-November-2024

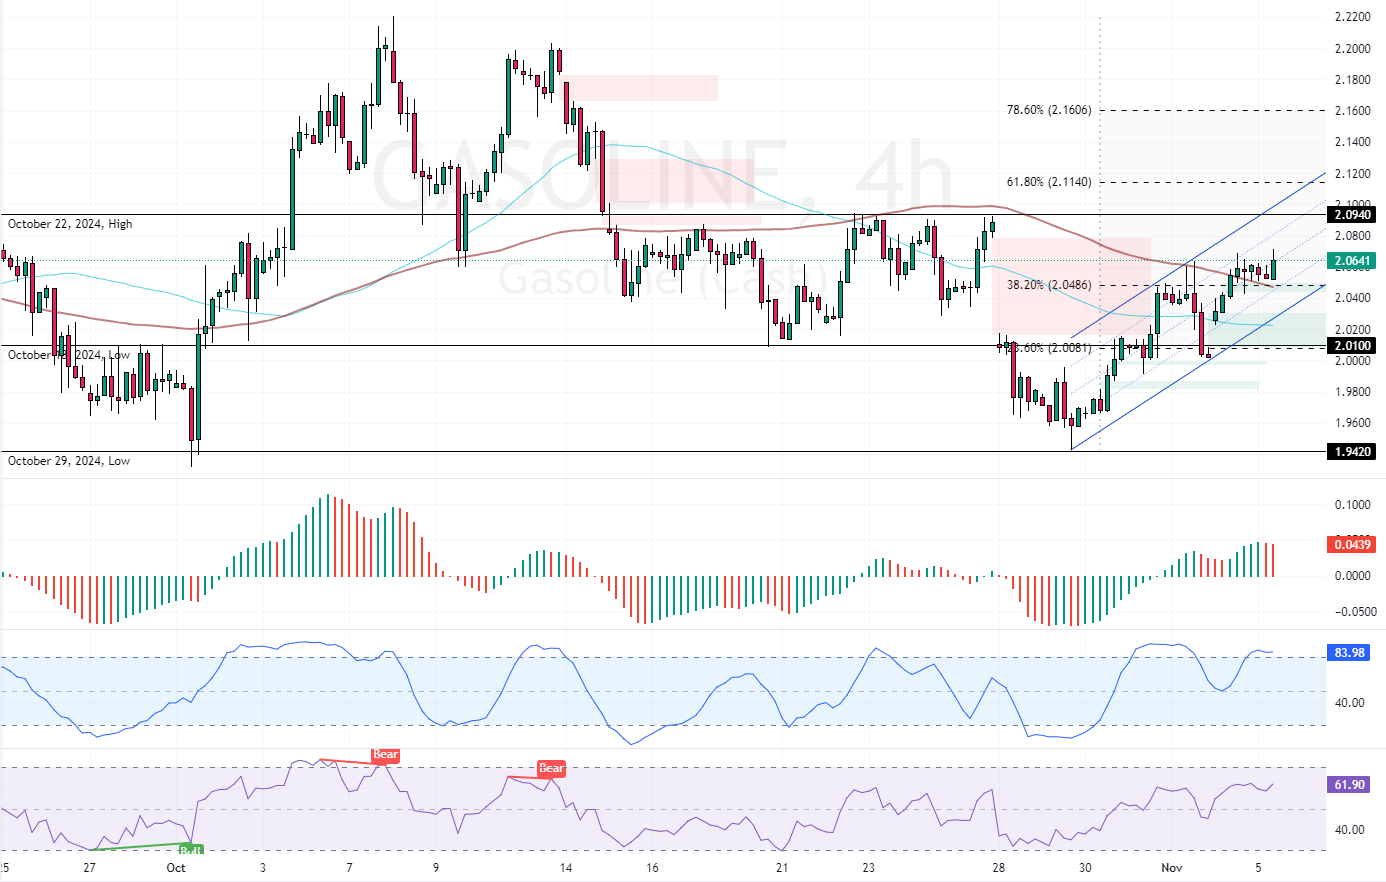
As of this writing, Gasoline trades at approximately $2.06, indicating the Stochastic Oscillator overbought signal. Additionally, the Awesome Oscillator bars turned red recently, meaning the bull market weakens. On the other hand, the Gasoline price is above the 100-period simple moving average, meaning the primary trend is bullish.
Overall, the technical indicators suggest that while Gasline’s primary trend is bullish, the price might soon experience bearish pressure.
Will Gasoline Drop Below $2.048 and Trigger Bearish Trend
The 38.2% Fibonacci retracement level at $2.048 is the immediate support. From a technical perspective, a new bearish wave would form if Gasoline drops below $2.048. In this scenario, the bears might initially target the October 18 low at $2.01, the 23.6% Fibonacci.
On the other hand, as long as the price is above the 38.2% Fibonacci, the market outlook remains bullish. Its next target is $2.094, the October 22 high.
Gasoline Support and Resistance Levels – 5-November-2024
Traders and investors should closely monitor the key levels below to make informed decisions and adjust their strategies accordingly as market conditions shift.
- Support: 2.48 / 2.01 / 1.942
- Resistance: 2.094 / 2.11 / 2.16