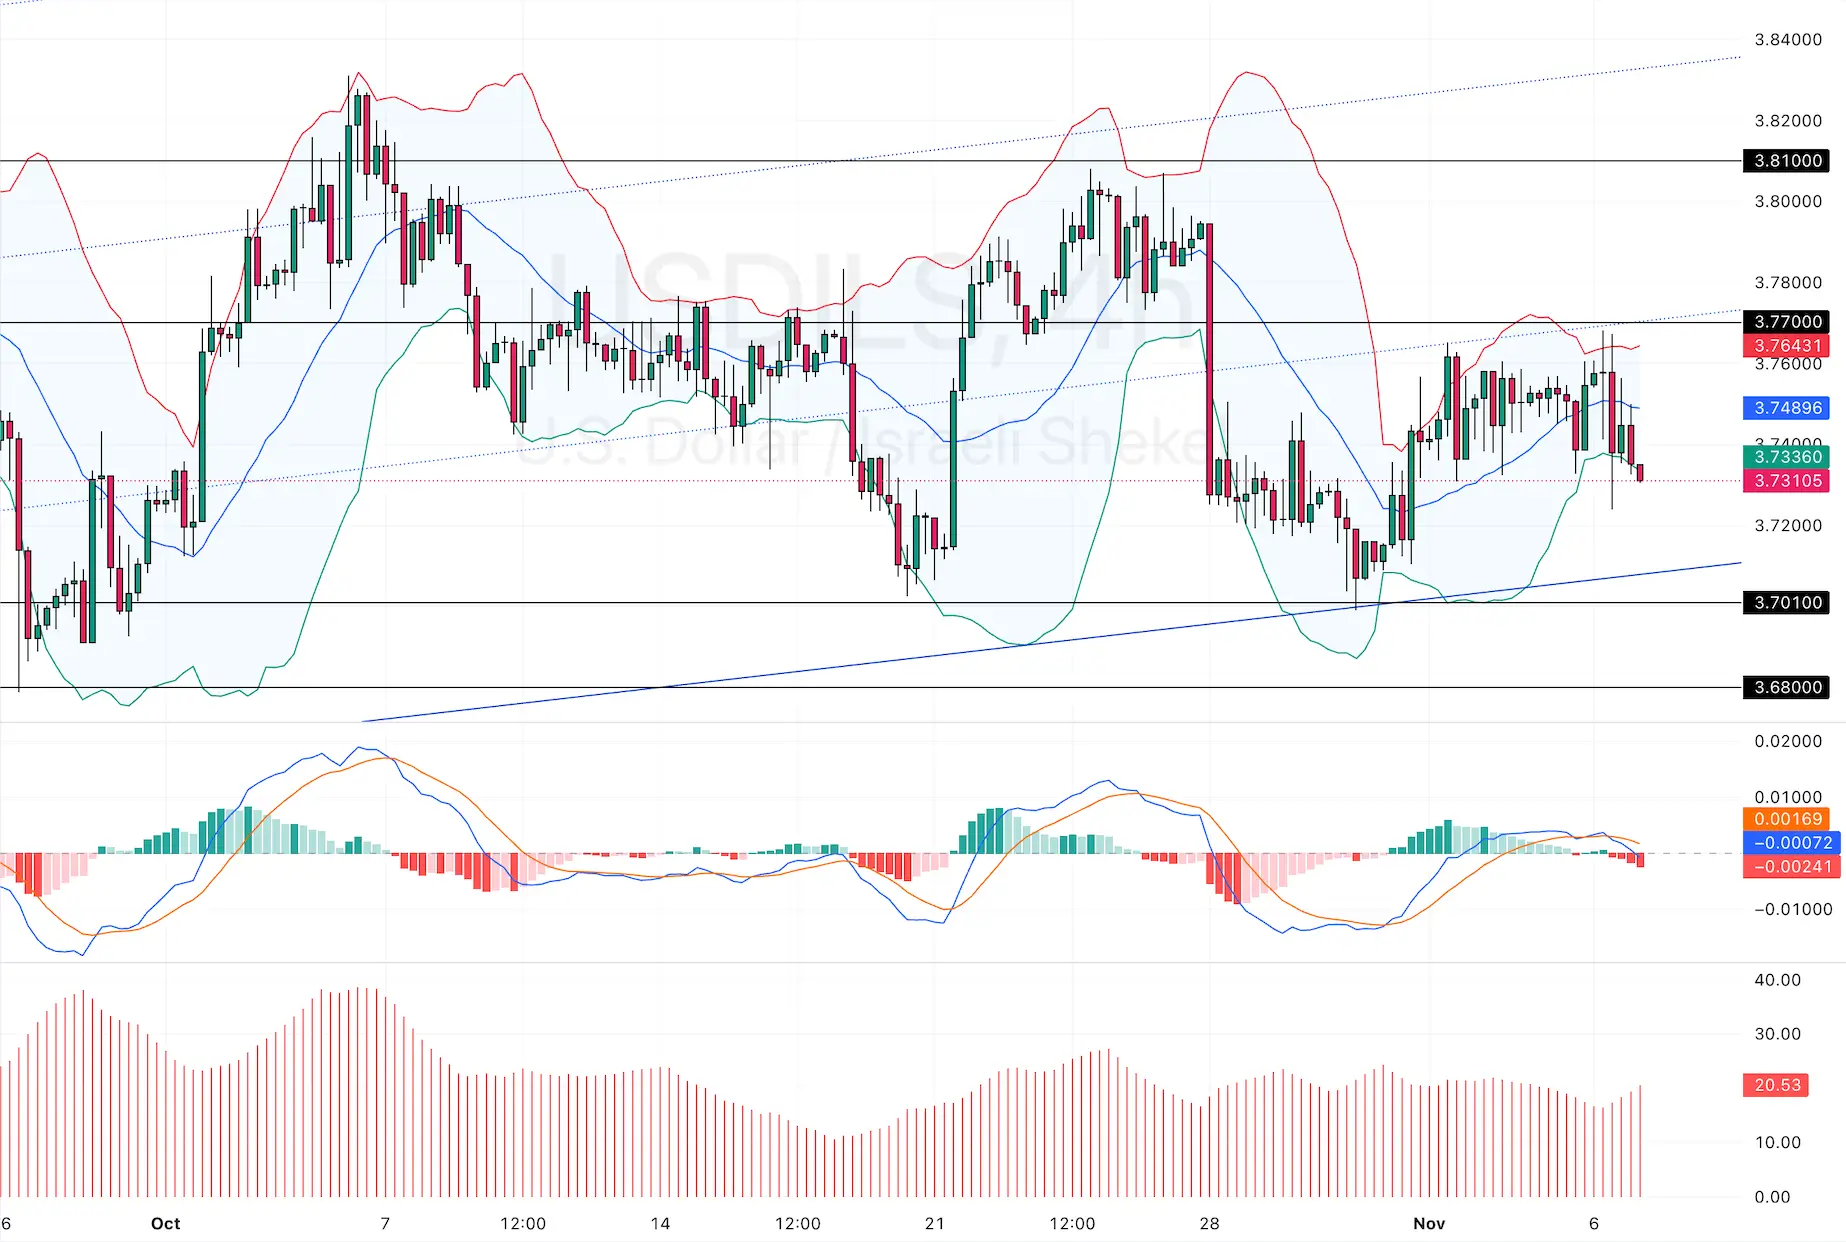
FxNews—The USD/ILS sideways momentum resumed below the 3.77 resistance and the 100-period simple moving average. As of this writing, the currency pair trades at approximately 3.73, pushing through the lower line of the Bollinger Bands.

USDILS Forecast – 6-November-2024
The technical indicators’ MACD bars are red and below the signal line, meaning the bear market should prevail. Additionally, the ADX depicts 20 in the description, showing the market gaining momentum.
The critical resistance level that divided the bull market from the bear marker rests at 3.77. From a technical perspective, the USD/ILS primary trend remains bullish below that mark. In this scenario, the downtrend may extend to the 3.701 resistance. Furthermore, if the selling pressure exceeds 3.70, the next bearish target could be 3.68.
Please note that the bearish outlook should be invalidated if the USD/ILS price exceeds the 3.77 resistance.