FxNews—Gold prices climbed above $2,620 per ounce, reaching their highest point weekly. This increase is mainly due to a weaker US dollar. Investors are now turning their attention to upcoming remarks from Federal Reserve officials. They are eager to learn more about the central bank’s plans for easing monetary policy.

Fed Rate Cut Odds Dip Below 59% for December
According to CME FedWatch, the chances of a 0.25% interest rate cut at the Federal Reserve’s December meeting have fallen below 59%. This dropped from 62% the previous day and over 65% a week ago.
Additionally, investors are closely watching President-elect Donald Trump’s choices for his cabinet positions. Rising geopolitical tensions are boosting demand for safe-haven assets like Gold. Ongoing conflicts in the Middle East and increasing strains between Russia and Ukraine are contributing to this heightened demand.
Gold Prices Near Key Resistance at $2635

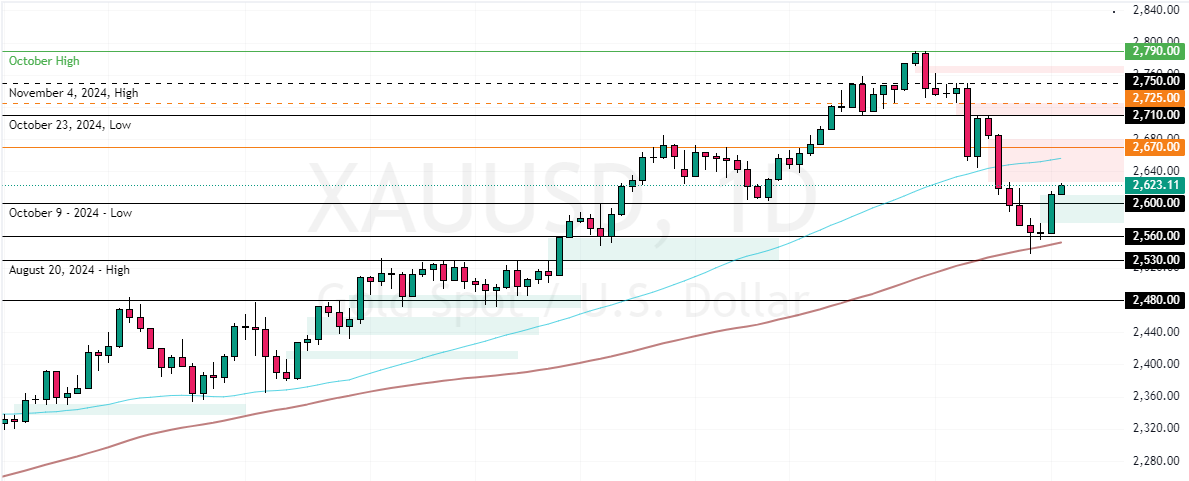
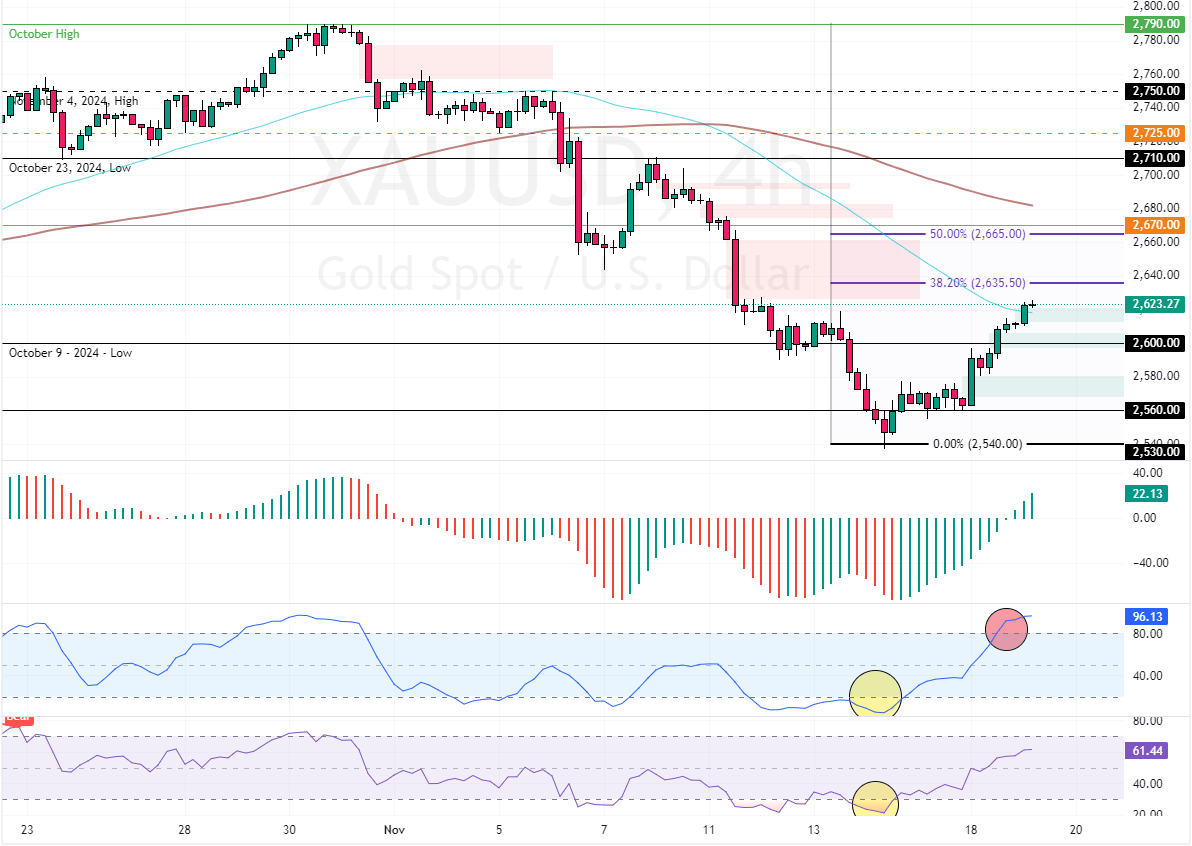
The XAU/USD pair bounced from the daily 50-period simple moving average, trading at approximately $2,626 in today’s trading session. The bulls are aiming to test the 38.2% Fibonacci level. Interestingly, the recent climb in the gold price resulted in the Stochastic Oscillator signaling overbought as the prices neared the critical resistance of $2,635.
Gold Technical Analysis and Price Forecast

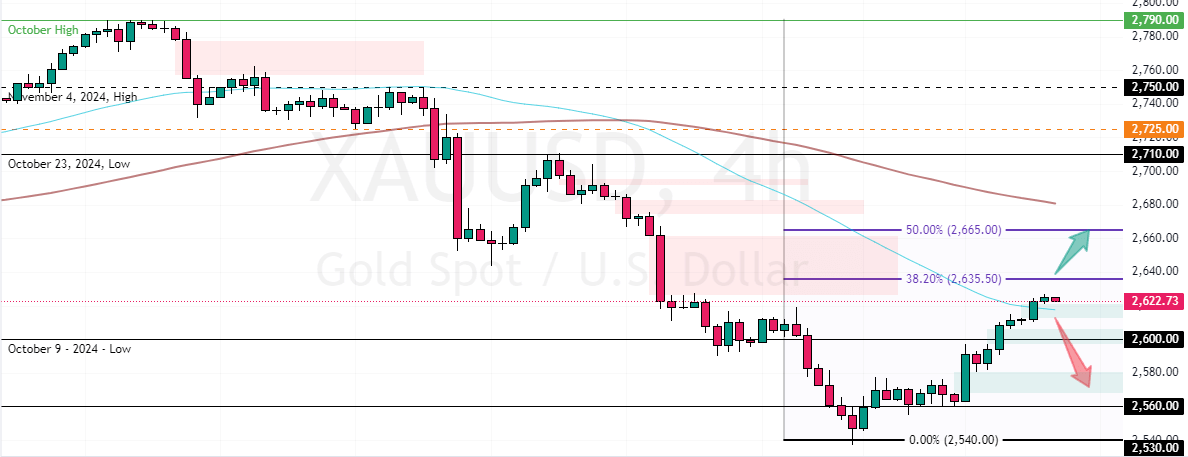
From a technical perspective, the downtrend will likely resume if Gold remains below the 38.2% Fibonacci ($2,635). In this scenario, Gold prices could retest the $2,600 support. Furthermore, if the selling pressure exceeds $2,600, the downtrend can extend to $2,560.
On the other hand, the uptick momentum could extend to the 50% Fibonacci retracement level if XAU/USD bulls pull the prices above the 38.2% Fibonacci.
Please note that the market outlook remains bearish as long as the prices are below the %50 Fibonacci level ($2,665), backed by the 4-hour chart 100-period simple moving average.