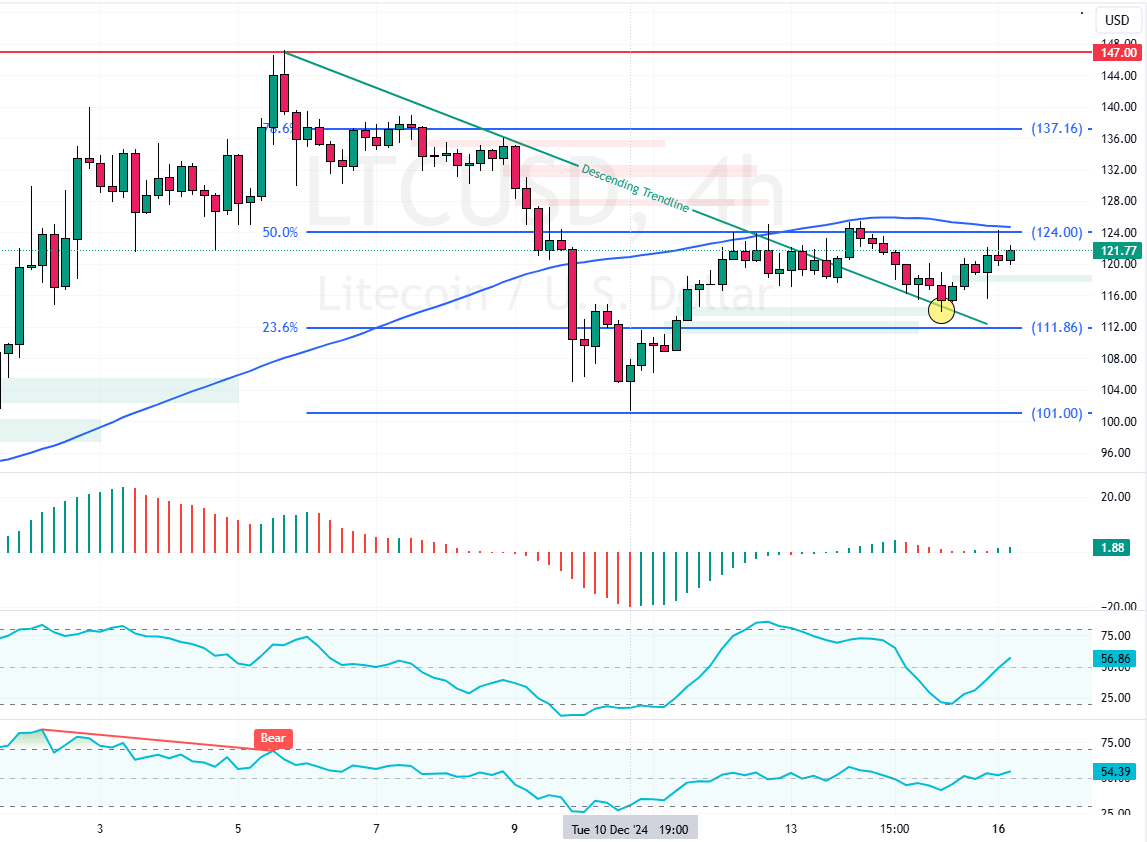
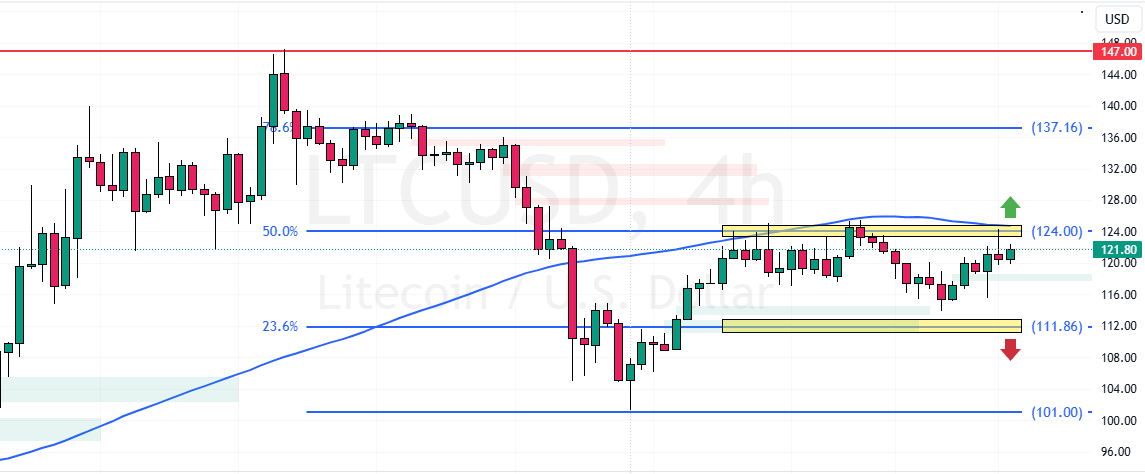
Litecoin tested the broken trendline at $111. The uptrend should resume if LTC/USD exceeds $124 resistance, with a target of $137.

Litecoin Technical Analysis – December-16-2024
FxNews—Litecoin has been trading sideways since December 11, erasing 22.0% of its recent losses. As of this writing, the cryptocurrency trades at approximately $124, testing the 50 Fibonacci level as resistance.
As for the technical indicators, the Awesome Oscillator bars are green and above zero, strengthening the bullish sentiment. Furthermore, the Stochastic and RSI 14 support AO’s signal by depicting 56 and 54 in the description.
However, the prices are slightly below the 75-period simple moving average, indicating the bull market needs a breakout.
Overall, the technical indicators suggest LTC is in a mild bull market, but a bullish breakout is required; otherwise, the downtrend resumes.
Litecoin Uptrend Potential with $124 Breach

The immediate resistance is $124, backed by the 50.0% Fibonacci level and the 75-period SMA. From a technical standpoint, for the Litecoin uptrend to continue, buyers must close and stabilize above this resistance.
In this scenario, the next bullish target could be the %78.6 Fibonacci resistance level at $124.0.
The Bearish Scenario
Please note that the bullish outlook should be invalidated if LTC/USD falls below the immediate resistance at $111.0, backed by the 23.6 Fibonacci level.
If this scenario unfolds, prices could aim toward the December 10 low at $101.0.