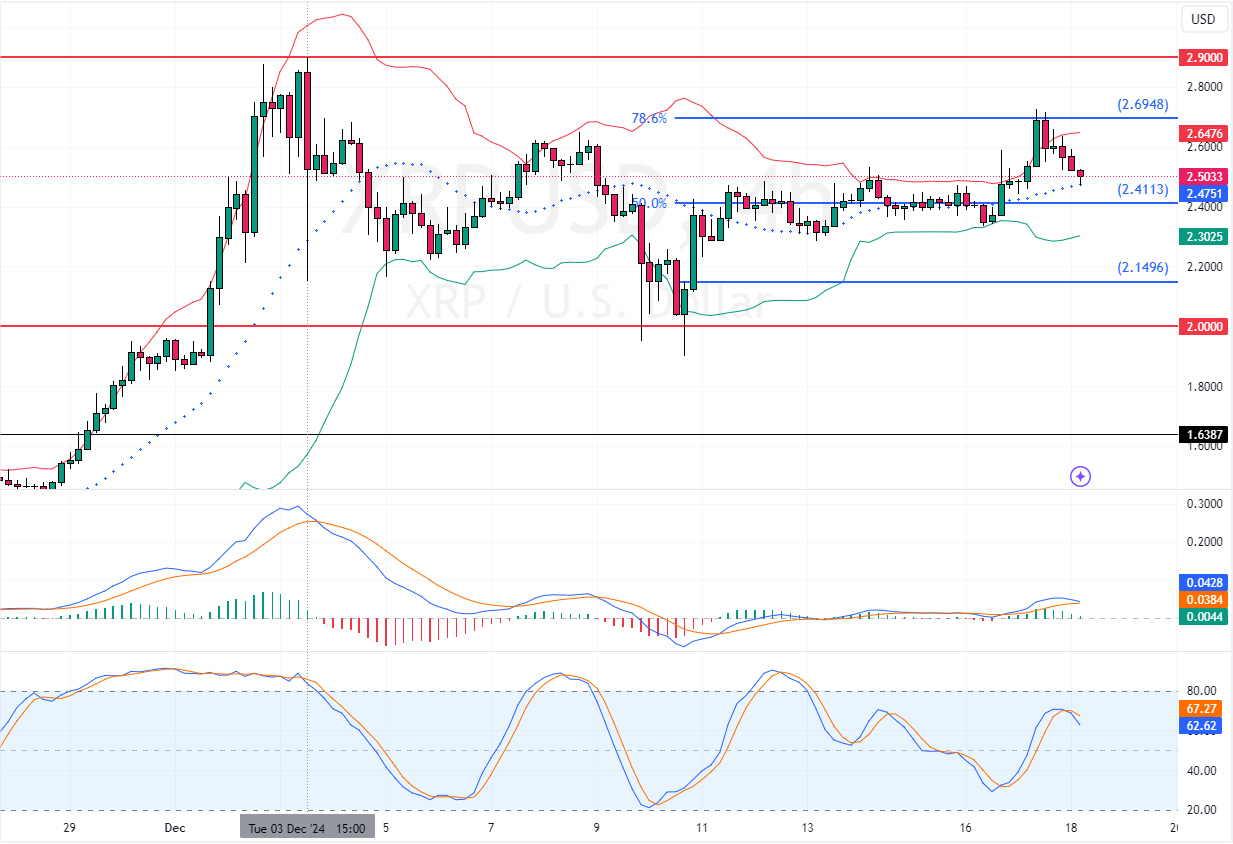
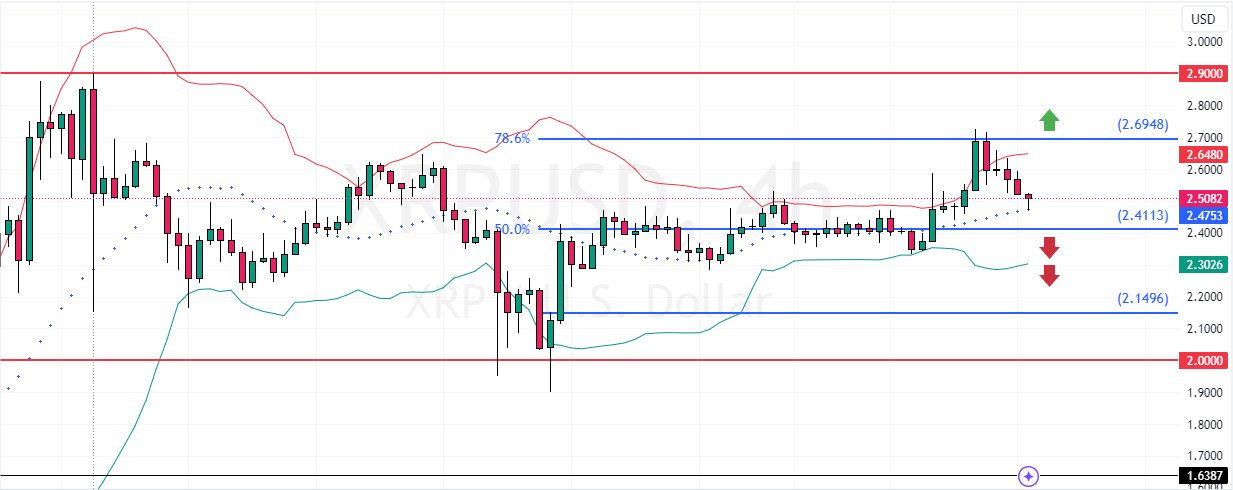
Ripple (XRP) trades sideways. It tested the 78.6% Fibonacci resistance level at $2.68. If bulls close above this level, the next target could be revisiting $2.9.
Please note that the market outlook for XRP/USD remains bullish as long as prices are above the $2.47 %50.0 Fibonacci retracement level.

Ripple (XRP) Technical Analysis – 18-December-2024
The cryptocurrency in discussion has been trading sideways since early December when its prices peaked at $2.90. As of this writing, XRP trades at approximately $2.5, returning from the 78.6% Fibonacci resistance level.
As for the technical indicators, MACD is declining and about to cross below the zero line. In addition, the Stochastic oscillator is dropping, recording 62 in the description.
These developments in the technical indicators suggest while the primary trend is bullish above the median line of the Bollinger Bands, the price could dip toward lower support levels.
Watch XRP for a Potential Drop to $2

The immediate support is at $2.41. From a technical perspective, XRP/USD could dip toward a lower support level if the market shifts below this support ($2.41). In this scenario, the downtrend could spread toward $2.14.
Furthermore, if the selling pressure drives the prices below $2.14, the bears’ path to $2.0 could be paved.
- Good read: Litecoin to Extend Gains Above $124
The Bullish Scenario
The immediate resistance is at $2.69. Please note that the bearish scenario should be invalidated if bulls pull the prices above this barrier. If this scenario unfolds, XRP could rise toward the December 3 high at $2.90.