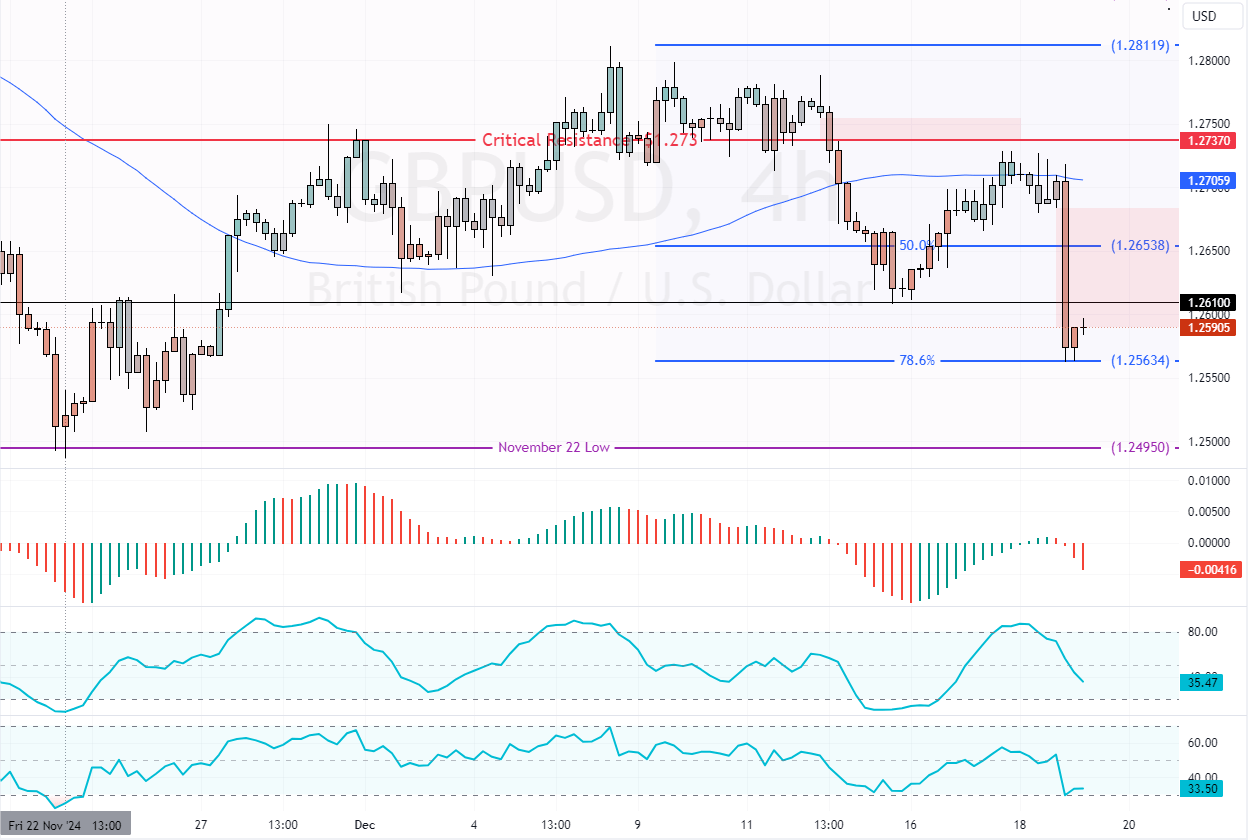
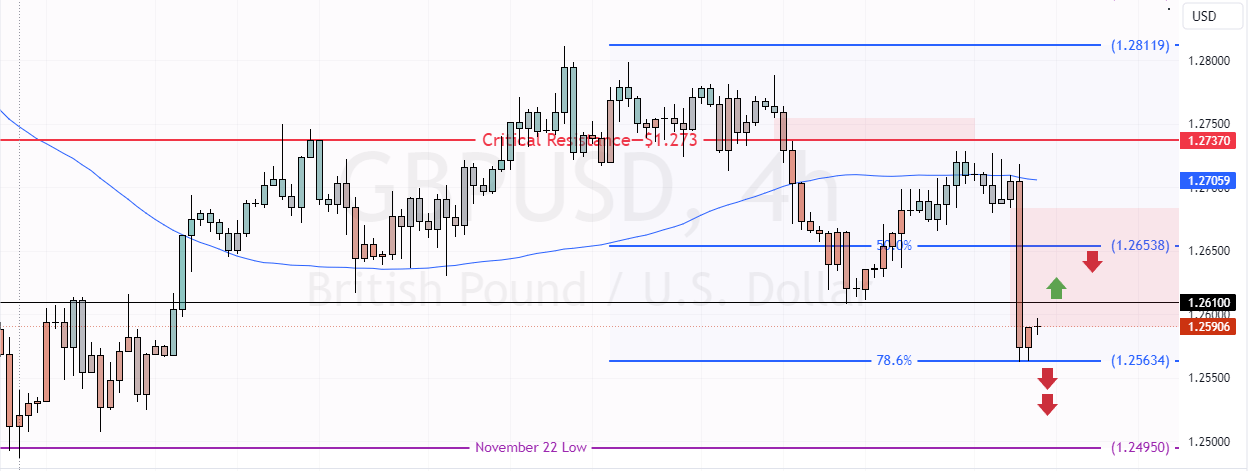
GBP/USD fell below $1.261, testing the 78.6% Fibonacci support level, leaving a bearish fair value gap behind. If $1.256 support holds, a consolidation phase could be on the horizon.
Traders and investors should monitor $1.261 and $1.265 for bearish signals, such as a candlestick pattern, for strategic selling prices. Furthermore, a dip below $1.256 will likely trigger the downtrend, targeting $1.249.

GBPUSD Technical Analysis – 19-December-2024
The British pound is in a robust downtrend against the American dollar, below the 75-period simple moving average. As of this writing, the currency pair trades at approximately $1.259, erasing 0.13% of yesterday’s losses.
As for the technical indicators, the Stochastic oscillator and RSI 14 records show 35 and 33, respectively, meaning GBP/USD is not oversold, and the downtrend should resume.
Overall, the technical indicators suggest the primary trend is bearish and should resume after a minor consolidation because yesterday’s trading session left a wide bearish fair value gap behind.
Potential GBPUSD Rise to 50% Fibonacci Level

Immediate resistance is at $1.261. From a technical perspective, the current uptick in momentum could extend to a higher resistance level if bulls pull GBP/USD above this resistance. In this scenario, prices could test the 50.0% Fibonacci retracement level, the 1.265 mark, as resistance.
Traders and investors should monitor the 1.261 and 1.265 marks for bearish signals, such as candlestick patterns because they offer a decent and low-risk entry point into the downtrend.
- Also read: NZDUSD Bear Market Prevails Below $0.57
Furthermore, the downtrend will likely resume if bears close and stabilize below $1.256. In this scenario, the next bearish target could be $1.249.
Please note that the bearish outlook should be invalidated if the GBP/USD prices exceed the critical resistance level of $1.273.