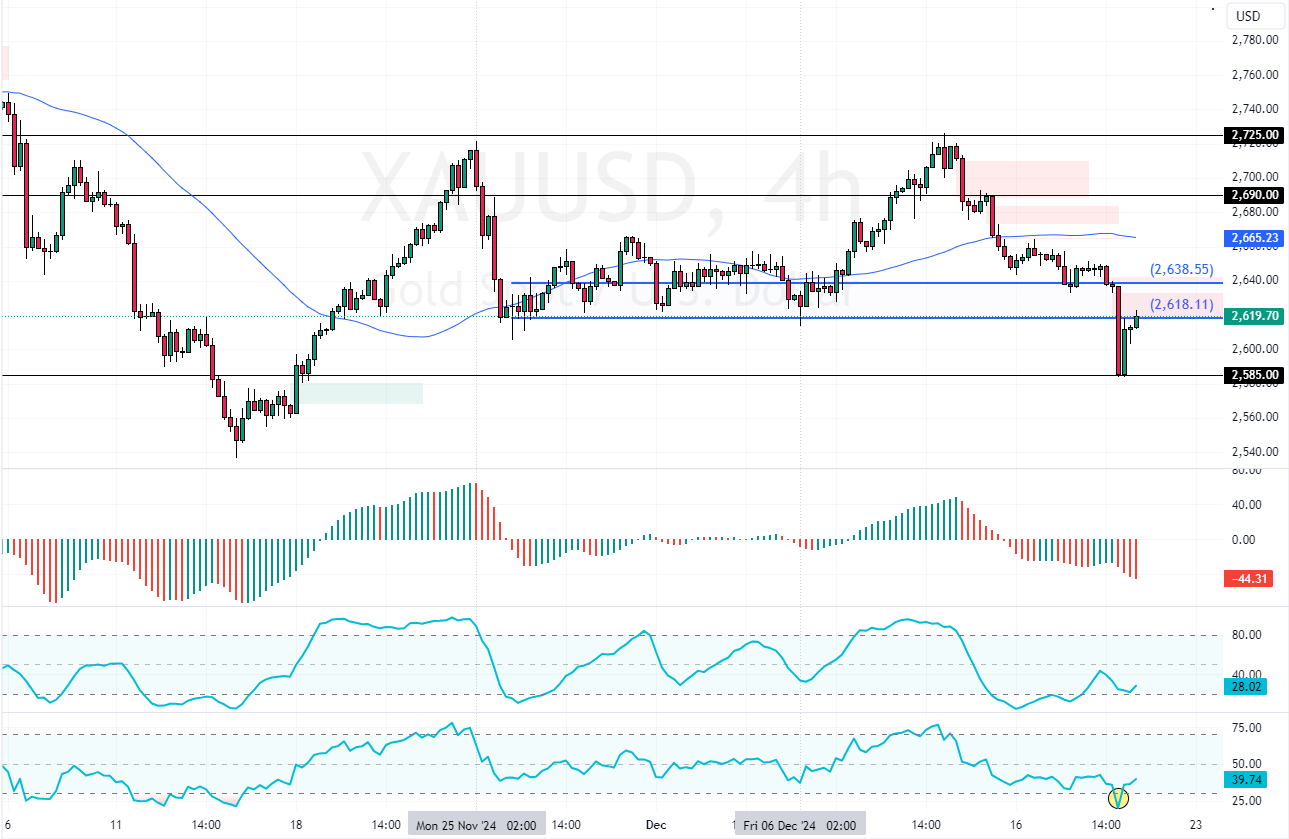
Gold‘s downtrend eased after prices declined to $2,585, which caused the RSI 14 to become oversold territory. Consequently, prices bounced from weekly lows and are trading at $2,620, testing the 23.6% Fibonacci level as resistance.

2025 to See Minimal Fed Rate Reductions
The recent downturn occurred after the Federal Reserve pointed out it might cut interest rates less frequently next year, suggesting only two reductions in 2025 based on current economic growth and ongoing inflation trends.
This Fed stance has reduced the commodity‘s attractiveness, as it does not yield interest, especially when monetary policy tightens.
Investors Eye Upcoming US GDP and PCE Data
Investors are poised to react to the forthcoming U.S. economic growth (GDP) figures and personal consumption expenditures (PCE) inflation data, as these indicators will likely influence future monetary policy decisions.
Gold Sees Largest Rise Since 2010
So far this year, Gold’s value has risen by over 27%, marking its most significant yearly increase since 2010. This increase was fueled by the easing of U.S. monetary policy, strong demand for secure investments, and considerable gold purchases by central banks.
Gold Technical Analysis – 19-December-2024

The XAU/USD’s trend outlook remains bearish as long as the prices stay below the 50-period simple moving average or the $2,640 resistance. As for the technical indicators, the Awesome oscillator bars are red, below zero, meaning the bear market should prevail.
On the other hand, RSI 14 left the overbought territory, indicating Gold prices could start a consolidation phase.
Watch Gold Drop Toward $2585 If Support Fails
The immediate support is at $2,605. From a technical perspective, the downtrend will likely be triggered again if Gold prices dip below this support. In this scenario, the $2,585 low could be revisited.
Furthermore, if the selling pressure exceeds $2,585, the sellers’ path to $2,560 could be paved.
- Also read: Crude Oil Slips Below $70 After Fed Decision
The Bullish Scenario
Please note that the bearish outlook should be invalidated if Gold’s value exceeds $2,640. If this scenario unfolds, the consolidation phase could extend to $2,660, backed by the 50-period simple moving average.