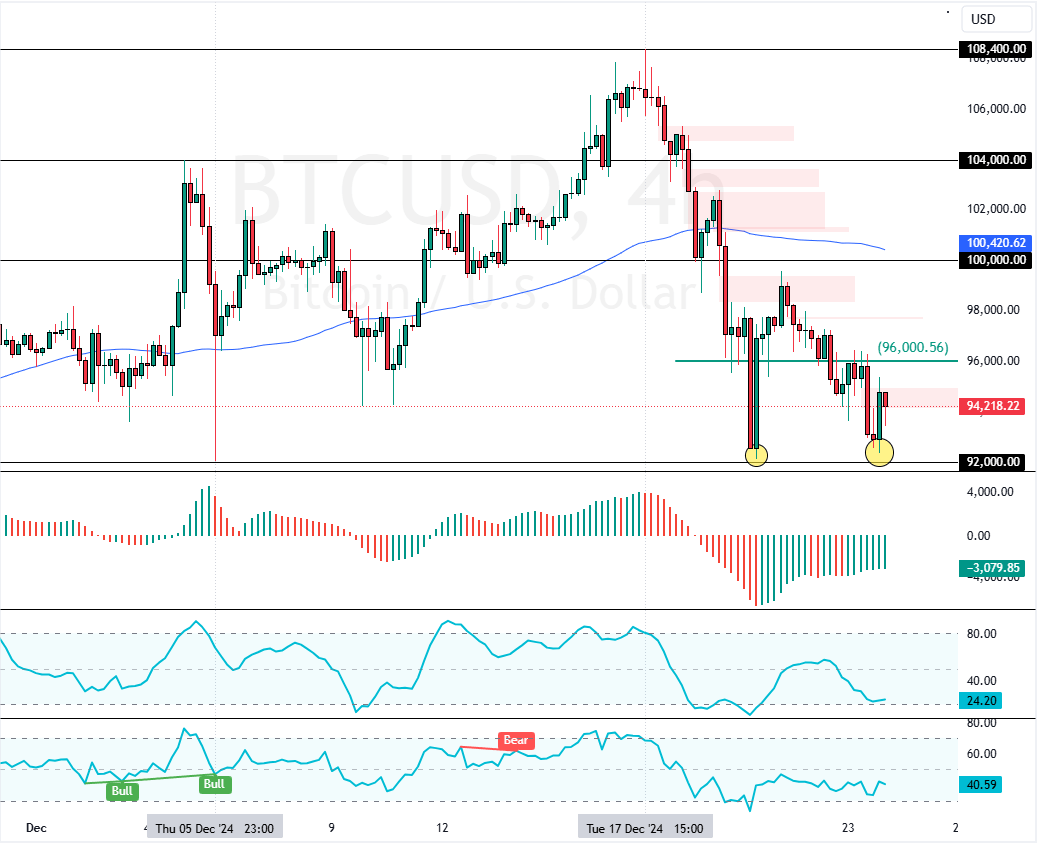
Bitcoin formed a double bottom pattern in the 4-hour chart at $92,000. If bulls pull the prices above the immediate resistance of $96,000, the digital gold could target $100,000.
Please note that the bullish outlook should be invalidated if BTC falls below the critical support of $92,000.

Bitcoin Technical Analysis – 24-December-2024
Bitcoin began a bearish trend after its prices rose to $108,400 on December 17. However, the sell-off eased near the critical $92,000 support, backed by the December 5 low. As of this writing, BTC/USD is pulling away from the vital support mentioned above, trading at approximately $94,000.
Regarding the technical indicators, the Awesome Oscillator histogram is green and below zero, meaning the bear market weakened. However, the Stochastic Oscillator and RSI 14 depict 23 and 40 in the description, interpreted as the prices are not oversold, and the downtrend could extend.
On the other hand, the cryptocurrency in discussion formed a double bottom pattern, which is a bullish signal.
Overall, the technical indicators suggest the primary trend is bearish, but Bitcoin prices could bounce from this point.
BTC to Target $100K if Bulls Break $96K

The immediate resistance is at $96,000. From a technical perspective, BTC/USD can potentially rise if bulls pull the prices above this level. In this scenario, Bitcoin will likely target the $100,000 psychological level.
- Also read: Ripple Faces Pressure: Lost Another 2%
Bearish Scenario
Please note that the bullish outlook should be invalidated if Bitcoin’s value drops below the critical support of $92,000. If this scenario unfolds, the downtrend will likely extend to the 38.2% Fibonacci support level at $85,700.