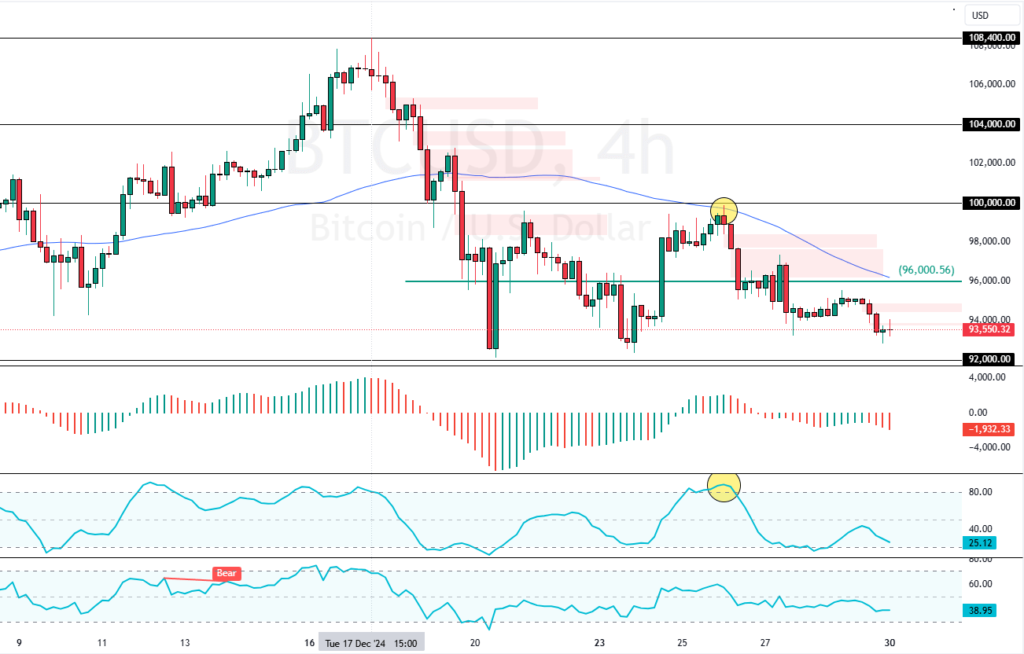
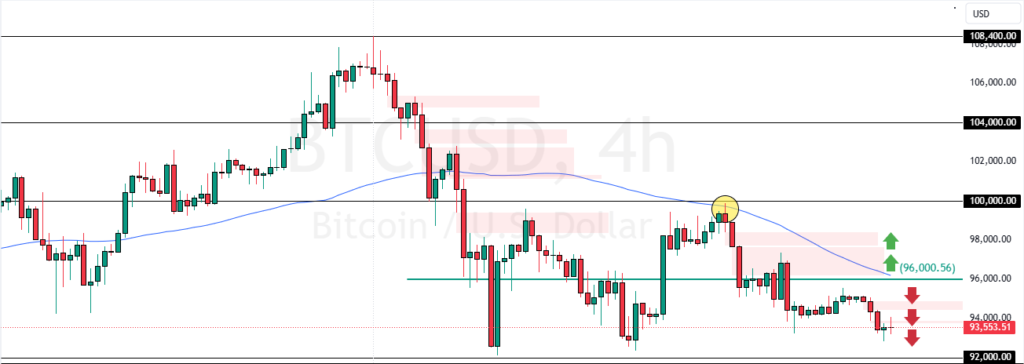
Bitcoin failed to surpass 100K. Consequently, it dipped below $96,000 with immediate support, backed by the 75-period SMA. If this level holds, BTC/USD is likely to target the December low at $92,000.
A close above the $96,000 immediate resistance should invalidate the bearish scenario.

Bitcoin Technical Analysis – 30-December-2024
As of this writing, Bitcoin trades at approximately $94,500, lost 7% of its value since December 26. The Awesome Oscillator histogram is red, below zero, meaning the bear market should prevail.
Furthermore, RSI and Stochastic records show 39 and 25 in the description, which can be interpreted as indicating that the market is not oversold and has room to decline further.
Overall, the technical indicators suggest that while the primary trend is bearish and should resume.
Bitcoin Failed to Surpass 100K

The immediate resistance is at $96,000. From a technical perspective, the downtrend could extend to lower support levels if bears (sellers) hold the BTC/USD prices below the resistance.
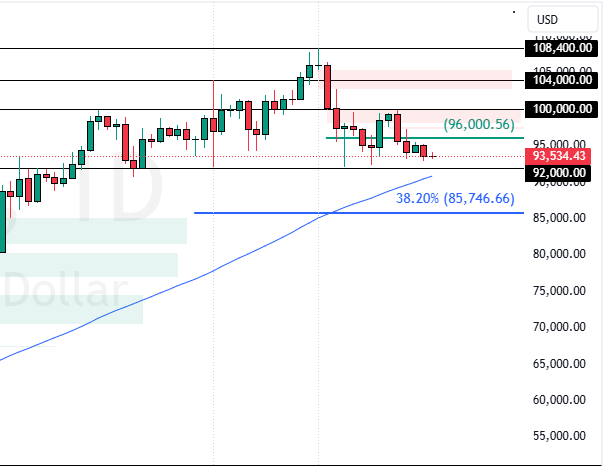
If this scenario unfolds, the next bearish target could be the December low at $92,000, followed by $90,000.
- Bitcoin Analysis: Technical, Fundamental & News

- Litecoin Gained 7.1%: What’s the Next Target?

- Bitcoin is up 6.6% Amid Divergence Signals: What’s Next?

The Bullish Scenario
The immediate resistance is at $96,000. From a technical perspective, a new bullish wave will likely emerge if Bitcoin’s value exceeds $96K. In this scenario, prices could revisit the $100,000 threshold.
Bitcoin Support and Resistance Levels – 30-December-2024

Traders and investors should closely monitor the BTC/USD key levels below to make informed decisions and adjust their strategies accordingly as market conditions shift.
| Bitcoin Support and Resistance Levels – 30-December-2024 | |||
|---|---|---|---|
| Support | $92,000 | $90,000 | $88,000 |
| Resistance | $96,000 | $100,000 | $102,000 |