FxNews – Unlocking Forex trading secrets often begins with a single step: understanding the Forex chart pattern. These patterns are the keys to the trading, the hidden codes that reveal trends and potential future movements in currency prices. Whether you’re new to the trading world or seeking to brush up on your skills, grasping the concept of Forex chart patterns can transform confusion into clarity, guiding your trading decisions toward more profitable outcomes.
Diving into the world of foreign exchange, or Forex, trading can feel like stepping into a complex maze, especially when you’re greeted with an array of charts and numbers. But fear not! Getting to know Forex charts is crucial for anyone aspiring to excel in trading, and it’s not as complicated as it might first seem.
This guide will simplify everything and give you a clear introduction to Forex charts. We’ll explain how to read them and how this knowledge can be a powerful tool in your trading arsenal. So, if “Introduction to Forex Charts” has been a puzzle you’re eager to solve, you’ve come to the right place!
What are Forex Charts?
Forex charts are like treasure maps that show how the prices of currency pairs change over time. They’re super important for Forex traders as tools that help you visually track market trends and make trading decisions based on the story these price movements tell.
Types of Forex Charts
1. Line Charts: Line charts are the simplest form of Forex charts, making them great for beginners. Picture a dot-to-dot puzzle; each dot represents a closing price, and the line connects them all. They provide a clear and straightforward view of a currency’s price movement over time, helping you spot overall market trends. For example, if the line continuously climbs, you see an upward trend.

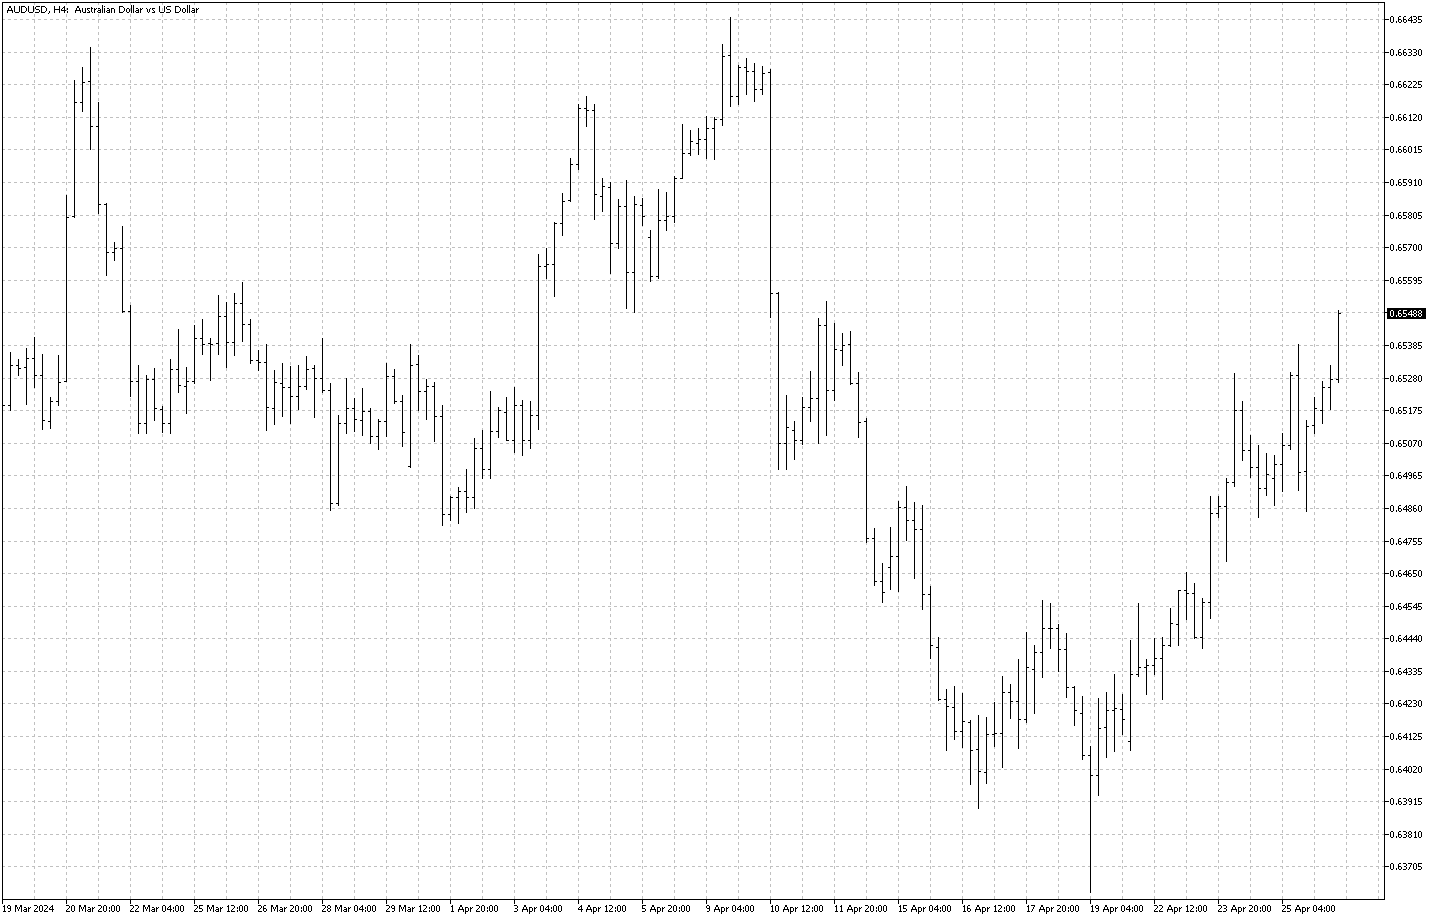
2. Bar Charts: If line charts are dot-to-dot puzzles, bar charts are like LEGO constructions. Each “bar” gives a more detailed summary of a currency pair’s price movement for a specific period. The top of each bar shows the highest price point, while the bottom represents the lowest. The left stick is the opening price, and the right is the closing price. For instance, if you see a series of bars getting progressively taller, it indicates a strong upward movement.

3. Candlestick Charts: Candlestick charts offer detail and visual appeal, presenting information in a way that’s easy to understand. Each ‘candlestick’ represents a currency’s open, high, low, and close prices for a specific time. A colored body (or ‘candle’) means the price dropped, while a clear or differently colored one indicates a rise.
The lines (or ‘wicks’) show the highest and lowest points. For example, if you see a series of long, colored bodies with short wicks, this typically indicates a solid downward trend.

Understanding Forex Chart Pattern
Chart patterns are footprints on the beach; they tell a story about what’s been happening with a currency pair’s price. Recognizing these patterns can give you a heads-up on future price movements.
1. Head and Shoulders: This pattern signals a potential trend reversal; it looks like a peak (head) between two higher peaks (shoulders). Imagine someone standing in profile—the shape you’re looking for on the chart.
2. Double Top and Double Bottom: These M- or W-shaped patterns signal a strong price reversal. A double top (M-shape) occurs after an upward trend and indicates a potential downturn. Conversely, a double bottom (W-shape) occurs after a downward trend, signaling a possible upward swing.
3. Triangles: These patterns indicate a consolidation in price movement, followed by a breakout. The direction of the breakout can often determine the future price trend.
Benefits of Mastering Forex Charts
1. Informed Decision-Making: Charts provide historical data in a visual form, helping you make informed decisions. Instead of guessing, you’re analyzing patterns and trends that have a historical basis.
2. Risk Management: Understanding charts helps you better plan your trades, including determining entry and exit points, thereby minimizing the risks associated with Forex trading.
3. Identifying Market Trends: Proficiency in reading Forex charts allows you to identify market trends and the right moment to trade, increasing your chances of profitability.
Conclusion
Forex charts are your allies in navigating the intriguing world of currency trading. From simple line diagrams to detailed candlestick representations, these visual aids are your secret maps to understanding market behavior. Moreover, recognizing chart patterns elevates your trading game, giving you insights into potential market movements.
Remember, practice and patience are your best friends here. With this accessible introduction to Forex charts, you’re better equipped to embark on your trading journey. Keep learning, stay vigilant, and let the charts guide informed and strategic trading choices!