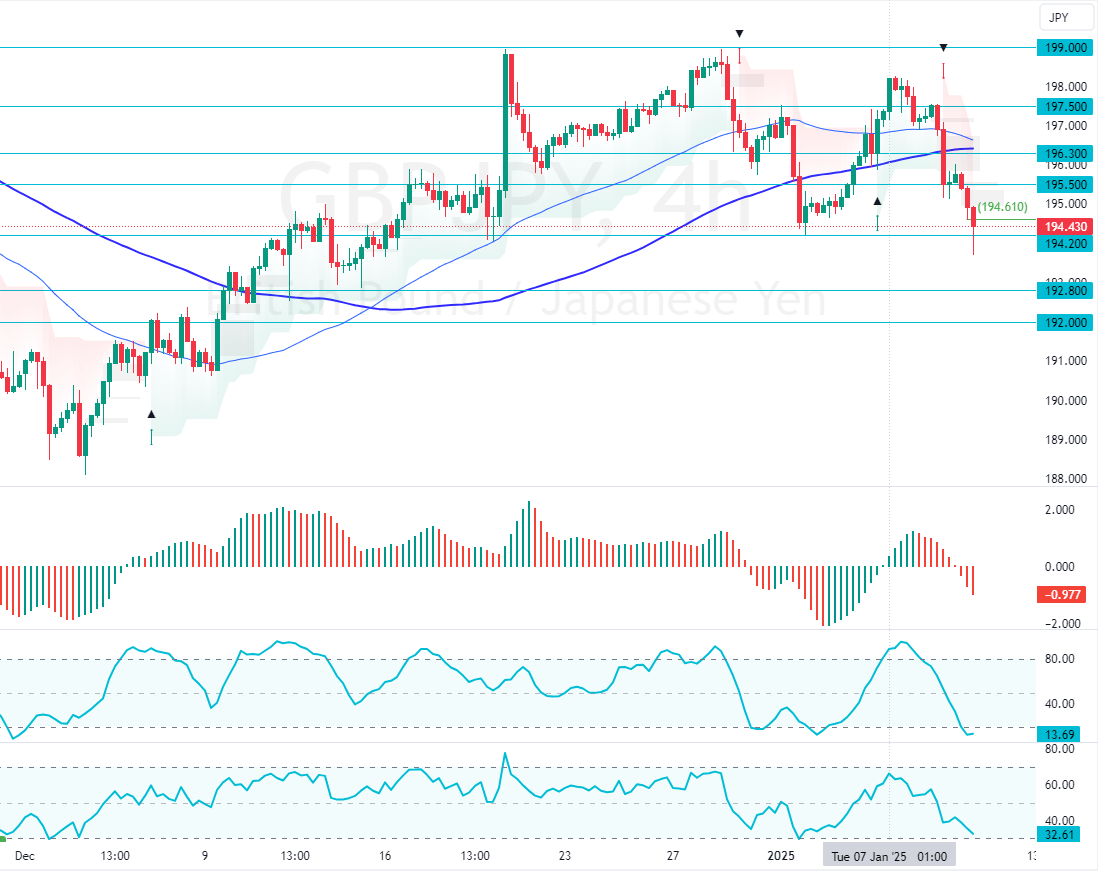
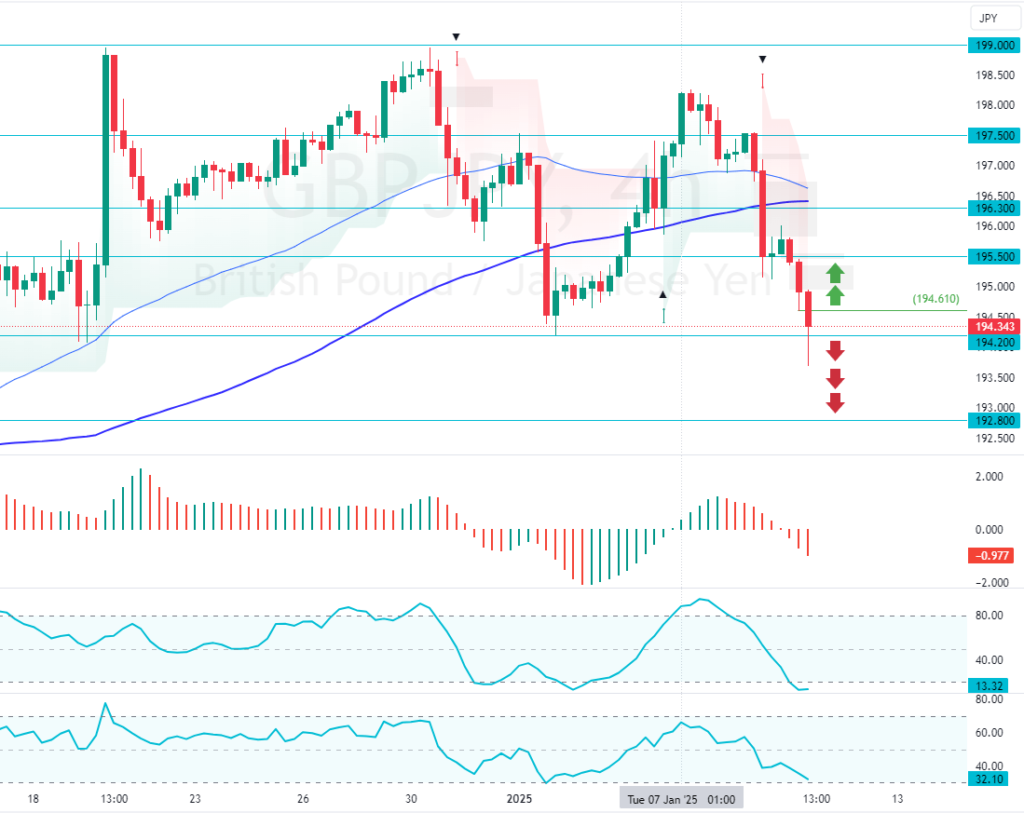
The GBPJPY downtrend extends to 194.2 amid oversold signals. The Stochastic oscillator is below 20, meaning the Japanese Yen could be overpriced. A consolidation phase toward a higher resistance level is anticipated.
Technical Analysis – 9-January-2025
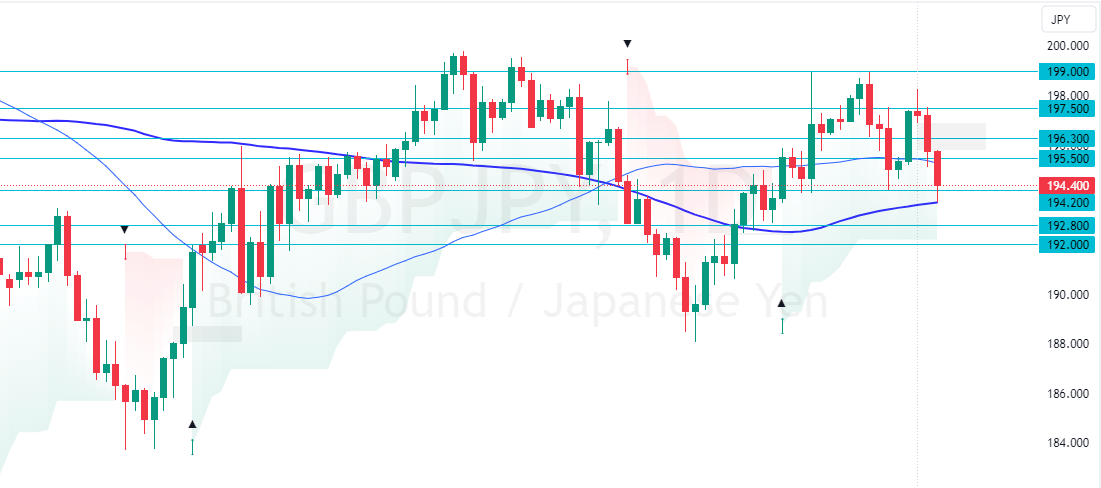
FxNews—The British pound shifted below the 50- and 100-period simple moving average this week, trading in a bear market. The pair has lost 4.5% of its value since January 7.
As of this writing, GBP/JPY trades at approximately 194.3 and bounced off 194.2 critical resistance level.
What Do Technical Indicators Reveal?
- The RSI 14 value is 32, nearing oversold territory. This means the Japanese Yen could be overpriced, at least temporarily.
- The Stochastic Oscillator value is 13, hovering in the oversold territory.
- The Awesome Oscillator histogram is red and below zero. This indicates that the bear market should prevail.
Overall, the technical indicators suggest that while the primary trend is bearish, GBP/JPY has the potential to rise toward upper resistance levels before the downtrend resumes.
GBPJPY Downtrend Extends to 194.2
Please note that the market is extremely oversold. Hence, retail traders and investors should wait patiently for the GBP/JPY to consolidate near upper resistance areas such as 195.5. They should also monitor this level for bearish signals, such as candlestick patterns.
That said, the trend outlook remains bearish as long as GBP/JPY’s value is lower than 196.3. In this scenario, the next bearish target could be 192.8.
The Bullish Scenario
The critical resistance level that has divided the bull market from the bear market rests at 196.3. A break above this resistance invalidates the bearish scenario and could push GBP/JPY to the 197.5 resistance.
In this scenario, the trend outlook is reversed from bearish to bullish.
Support and Resistance Levels – 9-January-2025
Traders and investors should closely monitor the GBP/JPY key levels below to make informed decisions and adjust their strategies accordingly as market conditions shift.
| Support and Resistance Levels – 9-January-2025 | |||
|---|---|---|---|
| Support | 194.2 | 192.8 | 192.0 |
| Resistance | 194.6 | 195.5 | 196.3 |


