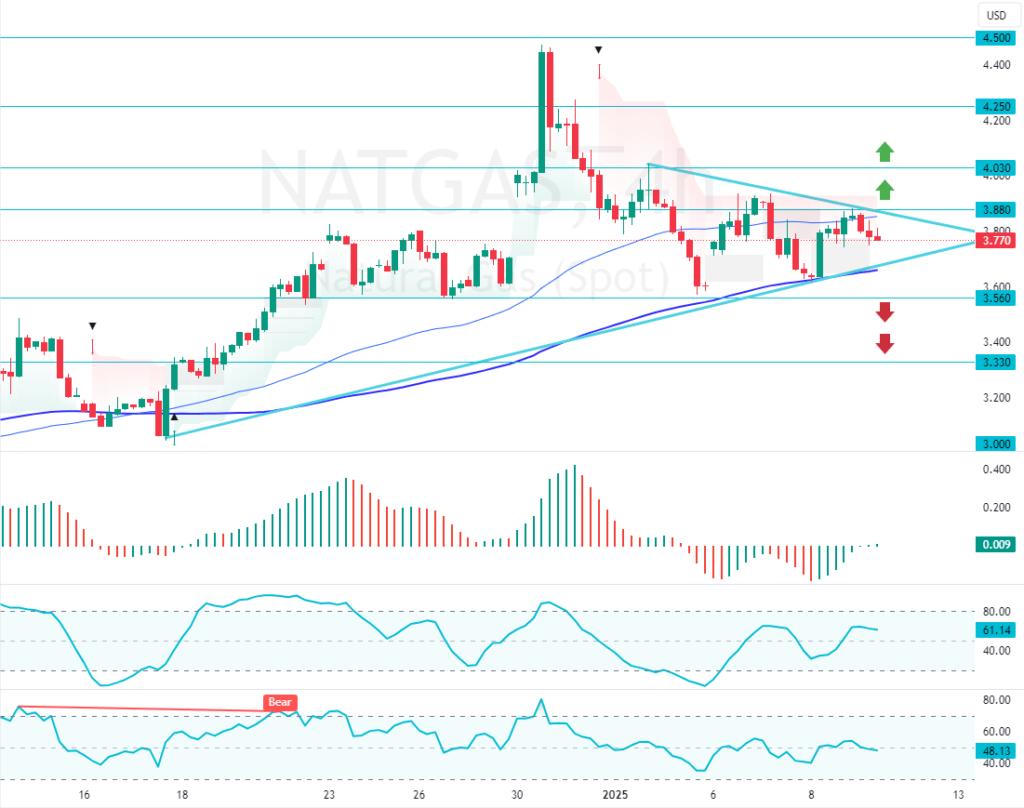
NATGAS trades sideways in a low-momentum market inside the bullish symmetrical triangle. The market awaits a breakout, and the Awesome Oscillator is signaling a bullish signal.
US Natural Gas Prices Rise After Smaller Storage Decline
The recent decline in the US. After the EIA’s report of a smaller-than-expected decrease in storage of 40 billion cubic feet (bcf) for the week ending January 3, natural gas prices are high. This figure was notably lower than the forecasted 53 bcf and the typical five-year average of 93 bcf, influenced by mild weather during the New Year’s holiday, which reduced demand.
Despite this, gas production declines have been less severe compared to previous winters, although the anticipated colder weather until January 23 could potentially increase freeze-offs.
LNG Exports Hit New Record at 15 bcfd in January
LNG exports continue to perform strongly, following the US export facilities averaging 15.0 billion cubic feet per day (bcfd) in January, surpassing December 2023’s record of 14.7 bcfd due to robust global demand.
Market volatility remains significant, as evidenced by price fluctuations exceeding 5% on ten of the past 11 trading days, contrasting with an average daily movement of 3.7% observed throughout 2024.
NATGAS Technical Analysis – 9-January-2024

Despite the low momentum market, the primary trend should be considered bullish because NATGAS is yet above the 100-period simple moving average. However, prices are stuck in a narrow range area, closing the bullish symmetrical apex and waiting for a breakout.
The immediate resistance is at $3.88. From a technical standpoint, the uptrend could resume if bulls (buyers) pull the commodity‘s prices above $3.88. In this scenario, the next bullish target could be $4.03, followed by $4.25.
The Bearish Scenario
On the other hand, a close below the immediate support at $3.56 invalidates the uptrend. If this scenario unfolds, the bearish wave from $4.5 will likely extend to $3.33.
