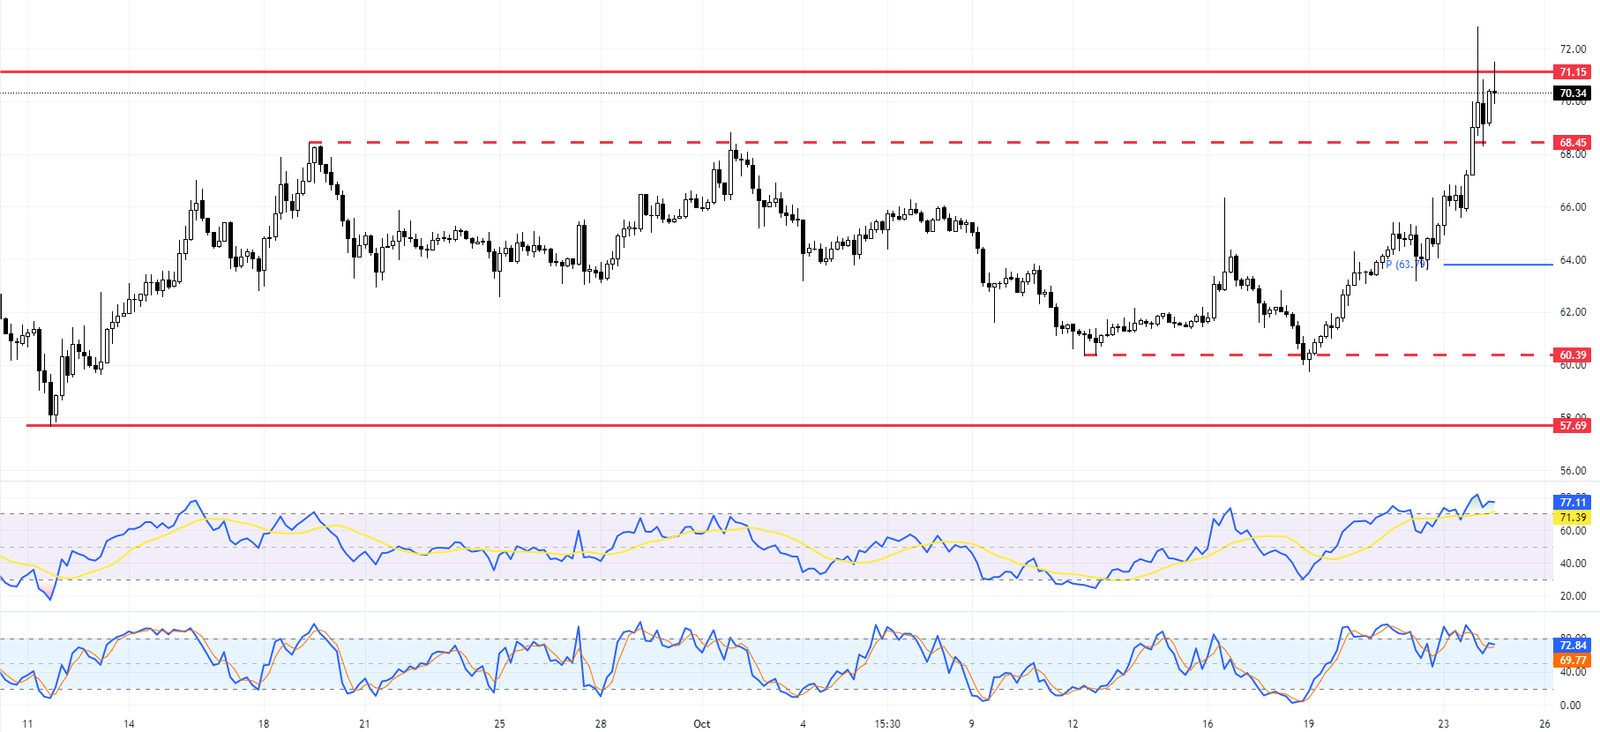
In today’s comprehensive Litecoin technical analysis, we will meticulously examine the details of the key levels for the LTCUSD pair.
LTCUSD Technical Analysis – Bullish Bias Holds Strong
Litecoin bulls are currently challenging the resistance at $71.15, following a successful breach and retest of the $68.45 level. The $64.45 level is now acting as a support line. The RSI indicator has lingered in the overbought territory for some time, suggesting a potential cooling-off period.

A long wick candlestick has formed on the 4-hour chart, hinting at a possible easing of upward momentum. Despite this, the outlook for the LTCUSD pair remains bullish as long as the price stays above the crucial support level of $68.45.
Should the price dip below this level, it could end the bullish bias, with bears potentially targeting the pivot point at $64. This comprehensive analysis provides key insights into Litecoin’s current market dynamics and potential future movements.