In today’s comprehensive GBPUSD technical analysis, we will first scrutinize the current economic conditions in the UK. Following that, we will meticulously delve into the details of the technical analysis of the GBPUSD pair.
On Tuesday, the FTSE 100 index saw a modest uptick, hovering around 7,340. Investors were busy digesting a mix of company reports and economic figures, all while waiting for the upcoming policy decisions from the Federal Reserve and the Bank of England.
Corporate Highlights
Rolls-Royce led the charge in the corporate arena and stood out as the star performer of the FTSE 100. The company’s shares jumped by 4.1% following a favorable update from Barclays analysts, who upgraded their stance on the aerospace titan to “overweight” and increased their price target from 230p to 270p.
Energy Sector Struggles
In contrast to Rolls-Royce’s success, energy stocks faced headwinds, particularly after BP’s earnings fell short of the mark. The oil behemoth reported a profit of $3.3 billion, which didn’t meet the $4 billion forecasted by experts. This shortfall came amidst a significant year-over-year decline in energy prices.
Vodafone’s stock dipped by 1.5%, as the news of its Spanish division sale did not sway investor sentiment. The telecom heavyweight is reshuffling its business portfolio to focus on regions with higher growth potential.
GBPUSD Technical Analysis
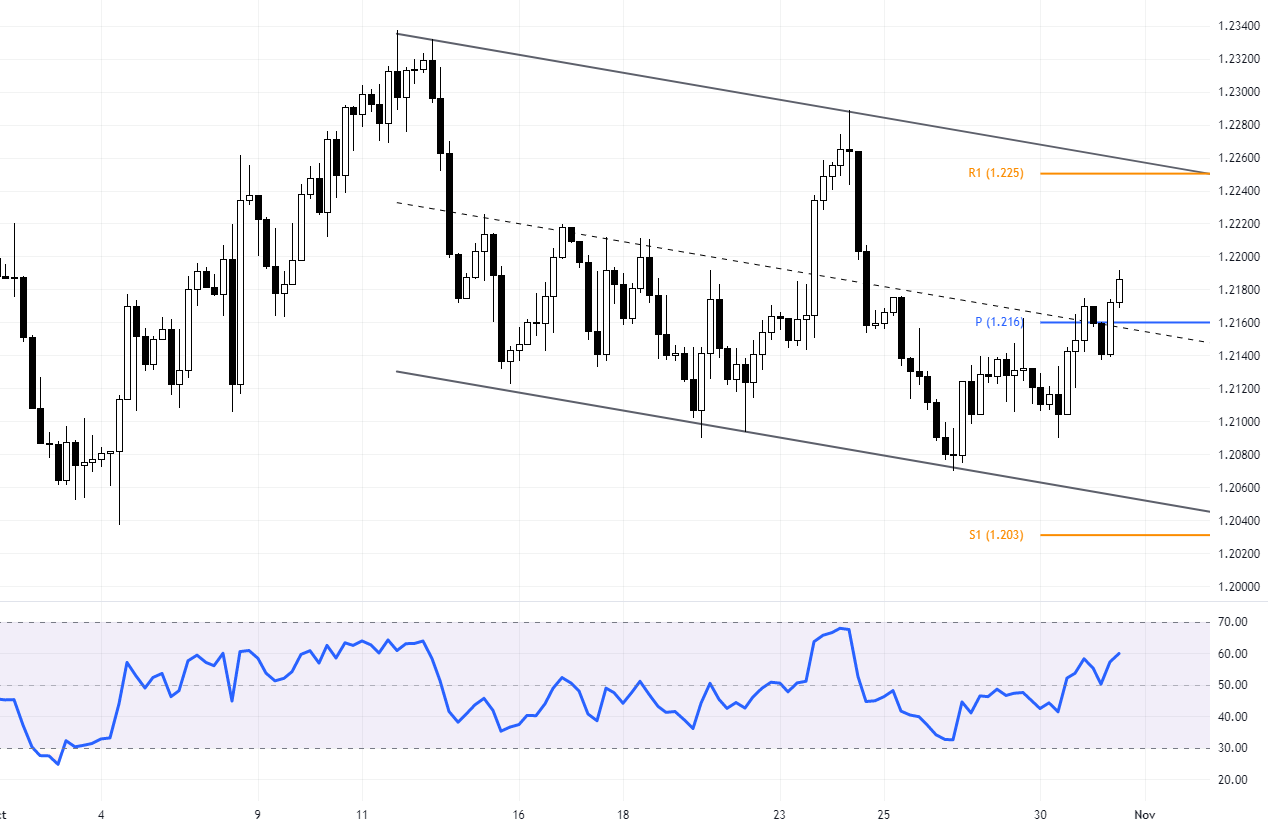
Let’s delve into a more detailed GBPUSD technical analysis. The pair is currently navigating a bearish channel. In the latest trading session, there has been a notable shift in momentum as the bulls successfully pushed the closing price above the pivotal 1.216 mark.

The Relative Strength Index (RSI), a key momentum indicator, is sustaining above the 50 threshold, which traditionally indicates a shift from a bearish to a more neutral or bullish sentiment among traders. This is an encouraging sign for buyers, as the RSI above 50 often precedes upward price movements.
Given the current position of the RSI, coupled with the bullish closure above the pivot point, there is a heightened probability that the GBPUSD pair may continue its ascent toward the upper boundary of the bearish channel. The next key level to watch is the R1 resistance at 1.225. If the price action can maintain its upward trajectory and reach this resistance level, it could signal a potential reversal of the current bearish trend or at least a significant retracement.