The forex market is like a giant puzzle, with pieces that change shape constantly. Investors who trade stocks and currencies are always looking for the best ways to guess how these pieces will fit together in the future. This is where a new helper, Lorentzian Classification, makes these guesses smarter.
What Is Lorentzian Classification?
Lorentzian Classification is an intelligent trading tool that examines past behavior of market prices. It sorts data using this history to predict where prices might move next. The indicator does this by simultaneously examining many pieces of data, like reviewing a picture from many angles to understand it better.
The Lorentzian classification indicator is built around the Lorentzian Distance Classifier (LDC). Imagine asking a brilliant friend to remember every little thing that has ever happened to a stock’s price and then make a good guess about what will happen tomorrow. That’s kind of what the LDC does. It uses a unique Lorentzian Classification method to make these guesses more precise.

Lorentzian Classification: Not Just for Scientists
The idea of Lorentzian space comes from a science called physics, which explains how the universe works. Even though it sounds very scientific, the cool thing is that this idea can also help people who trade in markets.
Think of Lorentzian Classification as a magnifying glass that can see through the noise and clutter of the market. It’s like having a pair of super goggles that help you focus on what’s critical instead of getting distracted by the little things that don’t matter. When traders use Lorentzian Classification, they can spot patterns and essential points they might have missed. It takes a big jumble of information about prices and times and makes it easier to see the bigger picture.
The Real-World Magic of Lorentzian Classification
The big deal about Lorentzian Classification is how it takes complicated math from physics and uses it to solve real problems in trading. It’s a new way of looking at how prices move over time, and it can be solid when it comes to ignoring the messy parts of the data that could trip you up.
Imagine you have a map of a city with all the roads and alleys. Now, if you had to find the best way from one point to another, you would want to avoid the streets that often have traffic jams, right? Lorentzian Classification helps traders do just that but with market prices. It shows them a more straightforward path by focusing on the big roads that matter.
Kernel Regression in Lorentzian Classification

Kernel Regression is a non-parametric regression that smooths out price data over time using a technique from statistical learning. The primary purpose of using Kernel Regression, or any smoothing technique, is to filter out the noise from random short-term fluctuations and highlight underlying trends in price movements.
The USDSEK chart above shows the Kernel Regression with a line that changes color from green to red depending on the trend’s direction.
How Kernel Regression Works
Smoothing Data: Kernel Regression uses a “kernel” function to weigh the data points differently based on their distance from the point of interest. This method provides a smooth curve that is less sensitive to outliers and shows a more reliable trend.
Trend Identification: By smoothing out the price action, traders can more easily identify the underlying trend without the distraction of the more minor fluctuations that occur on a day-to-day basis.
Signal Generation: A Kernel Regression line can also be a signal generator for trades. For instance, traders might consider buying when the price of a currency pair rises above its Kernel Regression line and selling when it falls below this line.
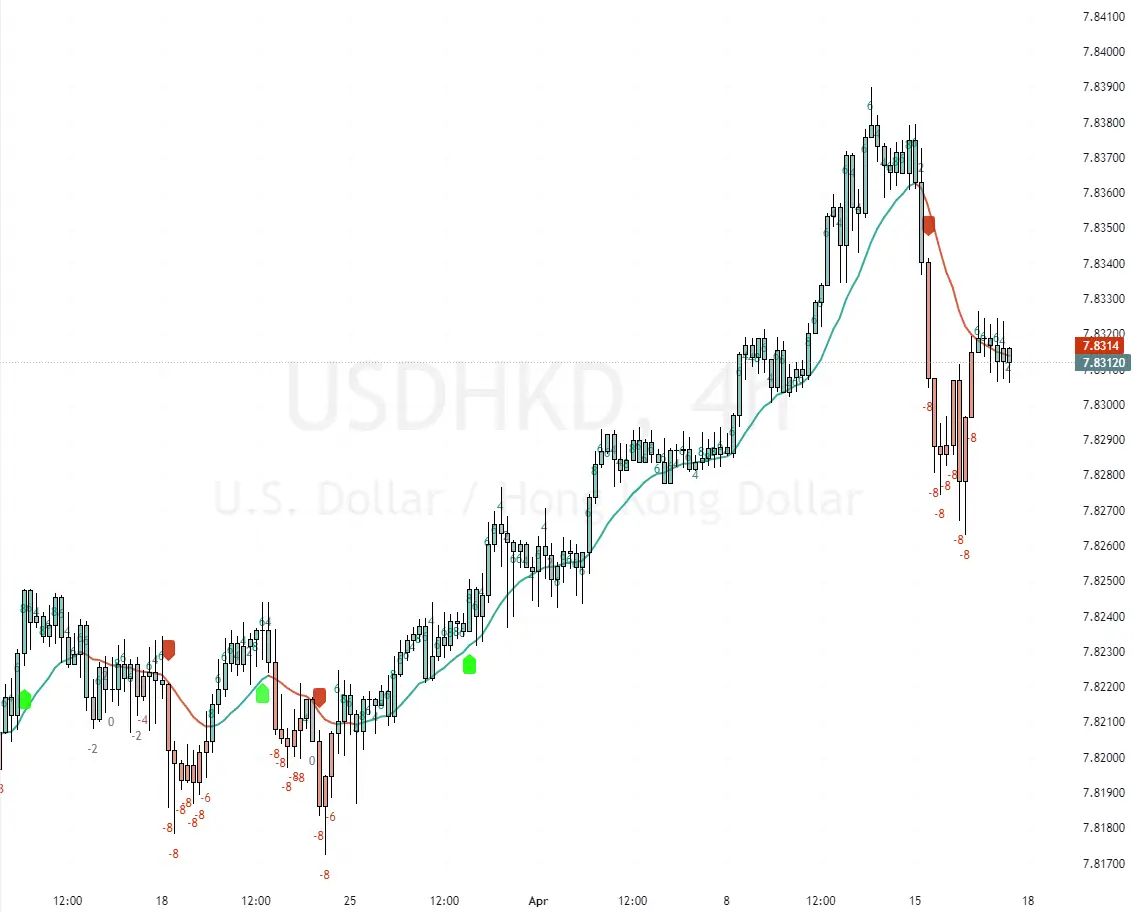
The USDHKD chart below shows how Kernel Regression shows if the market is in an uptrend or downtrend. When the price of the trading instruments shifts or hovers above the Kernel line, the color changes to green, and when the market dips below the indicator, the color changes to red. This way, traders and investors can make informed decisions about the market trend and its current direction.

Risk Management: This regression can help set stop-loss orders or decide entry and exit points by providing a clearer view of where the prices might find support or resistance.
For instance, if a trader goes long or opens a buy position on the USDHKD currency pair, the stop loss should be placed below the kernel line. Alternatively, the investor can close the buy trade if the price dips below the kernel line, which consequently causes the line’s color to turn red, showing that the bull market will likely be invalidated.
Overall, Kernel Regression in Forex technical analysis helps traders make more informed decisions by focusing on the main trends and reducing the impact of noise. This technique is especially useful in highly volatile markets where short-term fluctuations can be misleading.
Stretching the Benefits of Lorentzian Classification
While Lorentzian Classification is pretty impressive, it’s not a magic wand. Savvy traders use it with other tools to get the best results, like this EURCHF technical analysis.
Think of it as using a screwdriver and a hammer when building something. Each tool has its job, but they work best when used together. Adding Lorentzian Classification to your toolbox means bringing something compelling to your trading game. It gives you a fresh way to look at the ups and downs of market prices and helps you make wiser choices about when to buy and when to sell.
Conclusion
Lorentzian Classification is changing the game for traders who want to stay one step ahead. By looking at the market through this new lens, they find patterns and possibilities that others might miss. And while using it alongside other methods is essential, it’s making the challenge of trading a little easier to tackle.