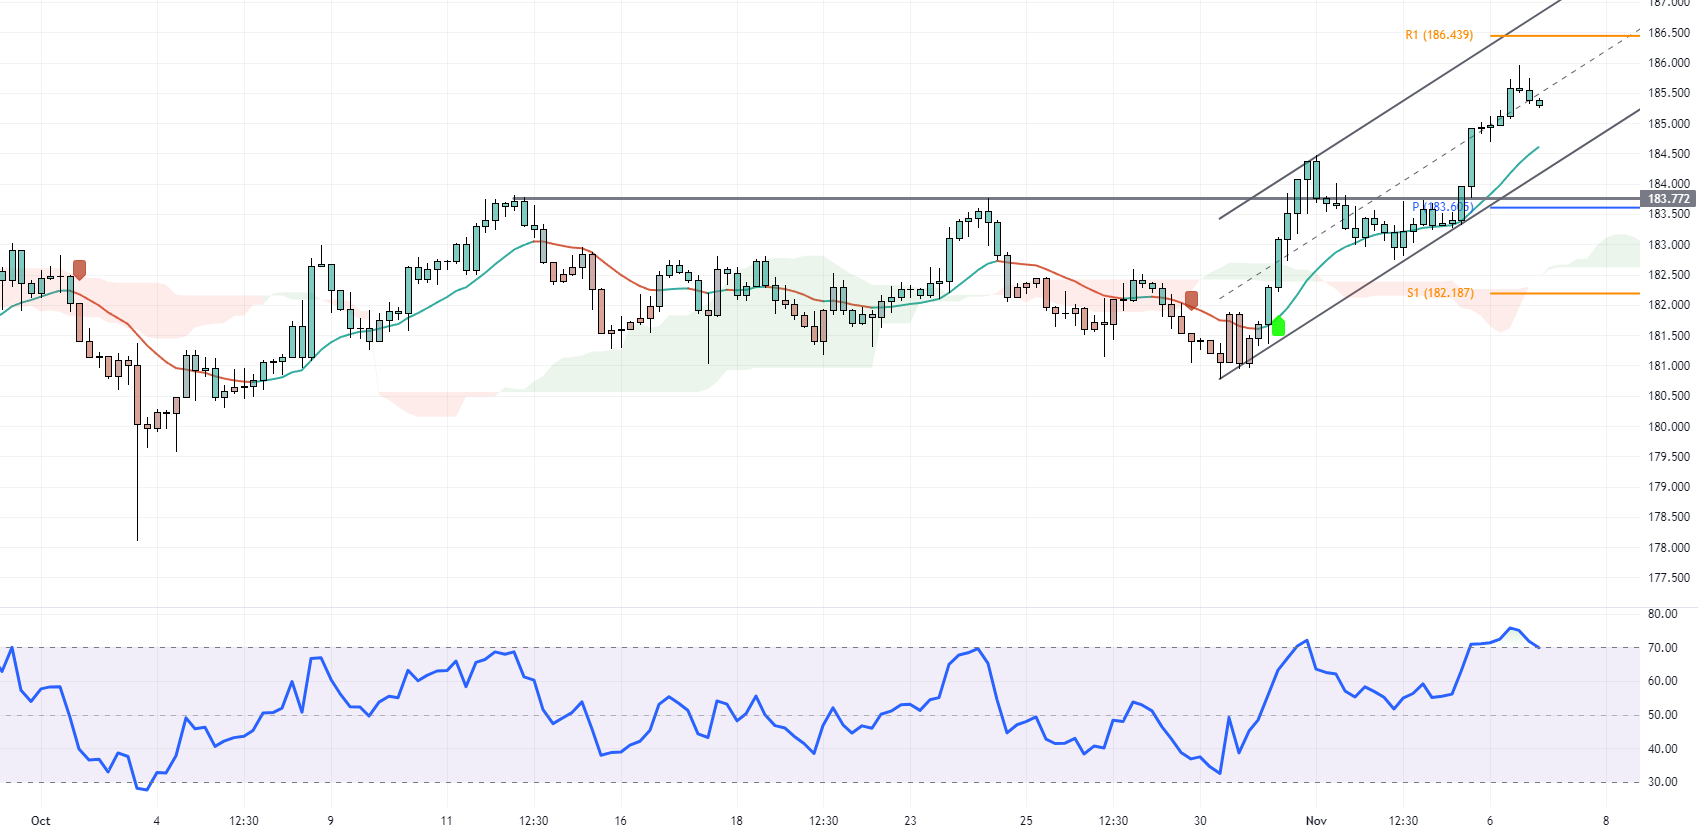
In today’s comprehensive GBPJPY forecast, we will first examine Japan’s current economic conditions. Then, we will meticulously delve into the details of the technical analysis of the GBPJPY pair.
A decline in Japan’s Long-Term Bond Yields
Bloomberg—In a recent turn of events, the yield on Japan’s 10-year government bonds dipped below 0.9%. This move departs from the decade’s highest values and mirrors the downward trend in global bond yields. This shift comes as the expectation solidifies that the era of hiking interest rates by the world’s major central banks may be drawing to a close.
In the United States, a disappointing jobs report for the month has strengthened the belief among many that interest rates might have reached their zenith. Despite this, Japanese Government Bonds (JGBs) yields are relatively high. This is partly due to the Bank of Japan’s (BOJ) recent fine-tuning of its approach to managing the yield curve.
The BOJ has kept its target for the 10-year JGB yield close to 0%, yet it has now characterized the 1% level as a flexible upper limit rather than a strict ceiling. Moreover, the commitment to purchase unlimited bonds to uphold this level has been withdrawn. Additionally, the BOJ has updated its inflation forecast, expecting a modest uptick in the core Consumer Price Index (CPI) inflation, inching closer to its 2% target for fiscal years 2023 through 2025.
GBPJPY Forecast – Key Levels to Watch
The GBPJPY pair has successfully closed above the Ichimoku cloud on the daily Chart. Chartis is currently testing the R1 resistance at 186.47. This level aligns with the middle line of the bullish channel, marking a significant point in our GBPJPY forecast.

Upon closer examination of the GBPJPY 4H chart, we identify potential trigger points. The RSI indicator is in the overbought zone, and the bears have formed a long wick candlestick pattern in today’s trading session. These candlestick patterns and technical indicators signal a potential correction or trend reversal in the market.
- Next read: GBPJPY Forecast – 4-June-2024
Our GBPJPY forecast suggests that the pair might test lower support levels like the Kernel or the bullish channel’s lower line. These levels could offer decent bids for the bulls, with risk below the 183.6 pivot.
