FxNews – The Average Directional Index (ADX) is a tool for technical analysis in Forex trading and other financial markets. Created by J. Welles Wilder, it assesses the strength of a trend.
About J. Welles Wilder
J. Welles Wilder started as a mechanical engineer and real estate developer before becoming a well-known finance technical analyst. In 1978, he wrote a book called “New Concepts in Technical Trading Systems,” introducing the Average Directional Index (ADX) and other vital indicators.
The ADX is part of Wilder’s Directional Movement System (DMS), which also has Positive (+DI) and Negative Directional Indicators (-DI). Wilder’s goal was to determine how strong the market trends were and in which direction they were going. His work was innovative, mainly using math in a field using subjective ways of looking at charts.
Wilder’s ideas came at a time when technical analysis was evolving quickly. Before him, analysts mostly used simple chart patterns and price movements. His methods opened the door for many of the tools used in analysis today. Since the late 1970s, the ADX has become popular in various financial markets, like stocks, commodities, and Forex. Its widespread use shows how effective it is in figuring out how strong a trend is, which is key in analyzing markets.
Using the ADX involves understanding Trend Strength Assessment. This part of the process checks how strong a market trend is. The ADX scores this strength from 0 to 100. A higher score means a stronger trend. This is crucial for traders to make sense of market changes.
How to Use ADX Indicator: Lines Explained
Scale from 0 to 100: The ADX indicator ranges between 0 and 100. It measures how strong a trend is in the market. The higher the number, the stronger the trend. A low number means a weak trend. This helps traders understand the trend’s power.

What Does ADX Indicator Measure?
The primary goal of the Average Directional Index (ADX) is to assess a trend’s strength, not to identify its direction (whether upward or downward). This distinction is vital for understanding the ADX, which focuses specifically on the intensity of a trend. It does not tell us if the trend is upward or downward but quantifies its strength.
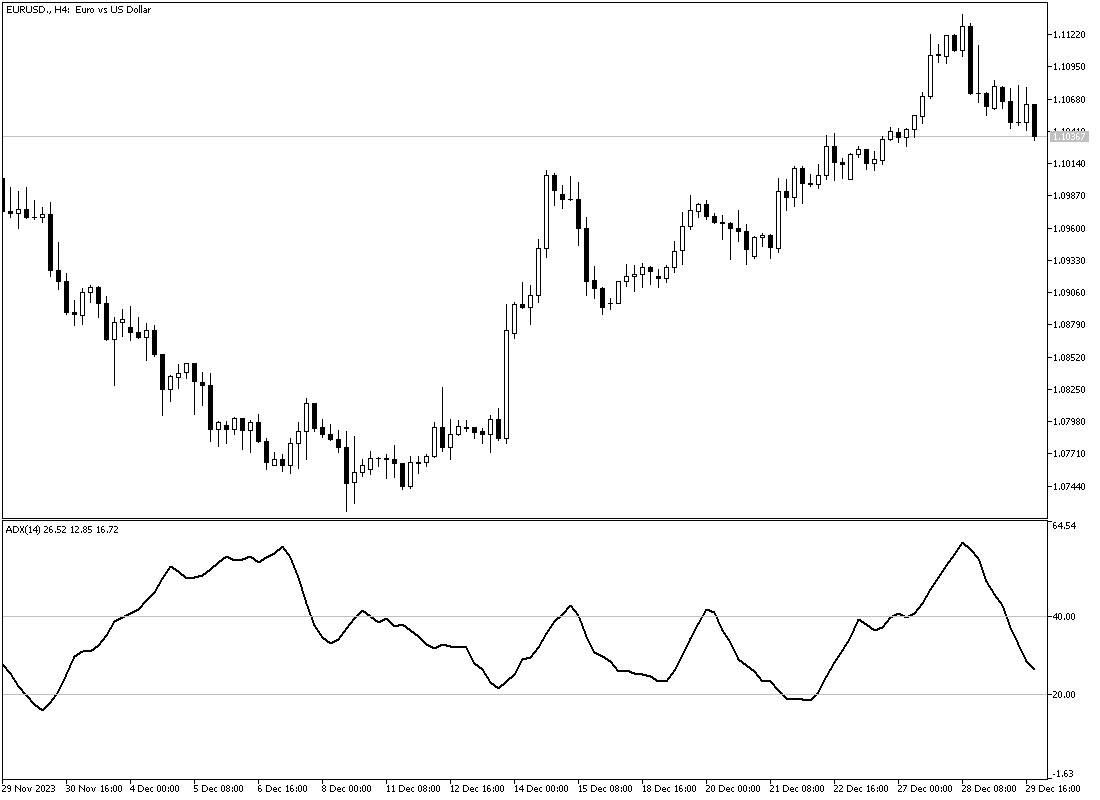
The image below illustrates that as the ADX indicator rises above 20, the strength of the market trend increases. Furthermore, when the ADX exceeds 40, the market trend becomes significantly more powerful.

This feature is essential for traders. By determining the strength of a trend, traders can differentiate between strong and weak trends. Strong trends are those which are more likely to persist. In contrast, weaker trends might indicate a potential reversal or a period of sideways movement. This information is crucial because it helps traders make informed decisions. A strong trend suggests a higher likelihood of continuation in the same direction, offering a degree of predictability. On the other hand, a weak trend signals uncertainty, indicating that the current trend might not be sustainable and could change direction.
ADX Reading Below 20 – Weak or No Trend
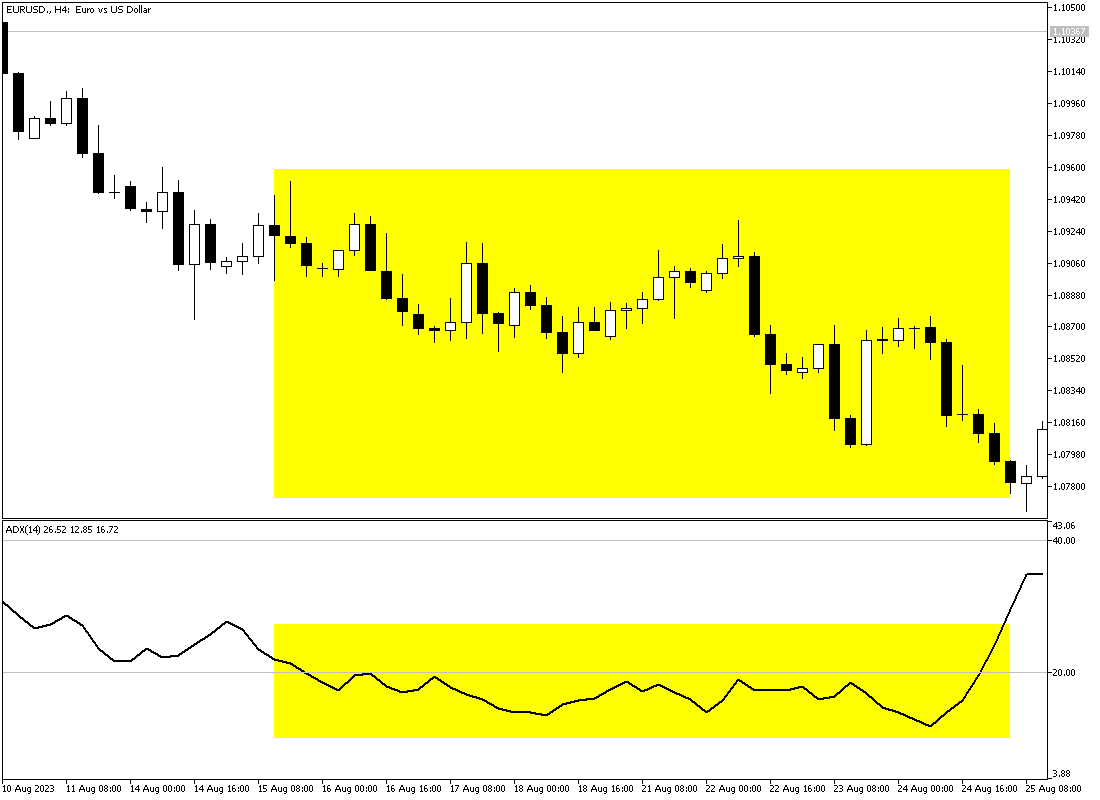
When the ADX value is below 20, it implies that the current market trend is not strong. This can mean one of two things: either there is a fragile trend or no trend at all. In practical terms, the market might be moving sideways. This sideways movement suggests that the prices oscillate within a specific range but do not move decisively in any direction, like up or down.
The EURUSD chart below presents the trend, which begins to slow down when the ADX indicator falls below the 20 level.

This information is crucial for traders. If they observe an ADX value below 20, they might conclude that it’s not an ideal time to employ trend-following strategies. Trend-following strategies typically rely on strong and clear market trends to be successful. Without such trends, these strategies might not work as well.
Instead, traders might look for alternative trading opportunities. One such opportunity is range-bound Trading. In range-bound Trading, traders capitalize on the market’s tendency to fluctuate within a set range. They aim to buy low and sell high within this range.
Alternatively, given the uncertainty and lack of clear direction when the ADX is below 20, some traders might choose to stay out of the market altogether. This decision is often driven by a preference to avoid Trading in conditions that don’t align with their strategies or risk tolerance.
ADX Intermediate Readings (20-25)
Numbers in the 20 to 25 range typically signal a shift in trends. A rising number suggests that a new trend is about to start. Therefore, traders often look for breakouts or pullbacks from lower lows or higher highs. Conversely, if the ADX values decrease, the trend weakens. This interpretation of ADX values between 20 and 25 is key to understanding changes in market direction.
In the EURUSD 4-hour chart below, the bulls on the pair crossed above the 1.1008 resistance. Concurrently, the ADX line stepped above the 20 level, continuing the bullish trend.

ADX Leading or Lagging Indicator
ADX is a lagging indicator, which means it relies on historical data to provide insights. It’s essential to recognize that lagging indicators, like the ADX, are not predictive technical indicators. They don’t foresee future market trends. Instead, they offer valuable information about trends that have already been established.
ADX lines Explain: The +DI and the -DI Signals
In addition to the ADX line, which gauges the strength of the market, the indicator also includes two signal lines: the +DI line and the -DI line. Incorporating these two lines has streamlined the operation with the ADX indicator, making it more efficient and user-friendly.
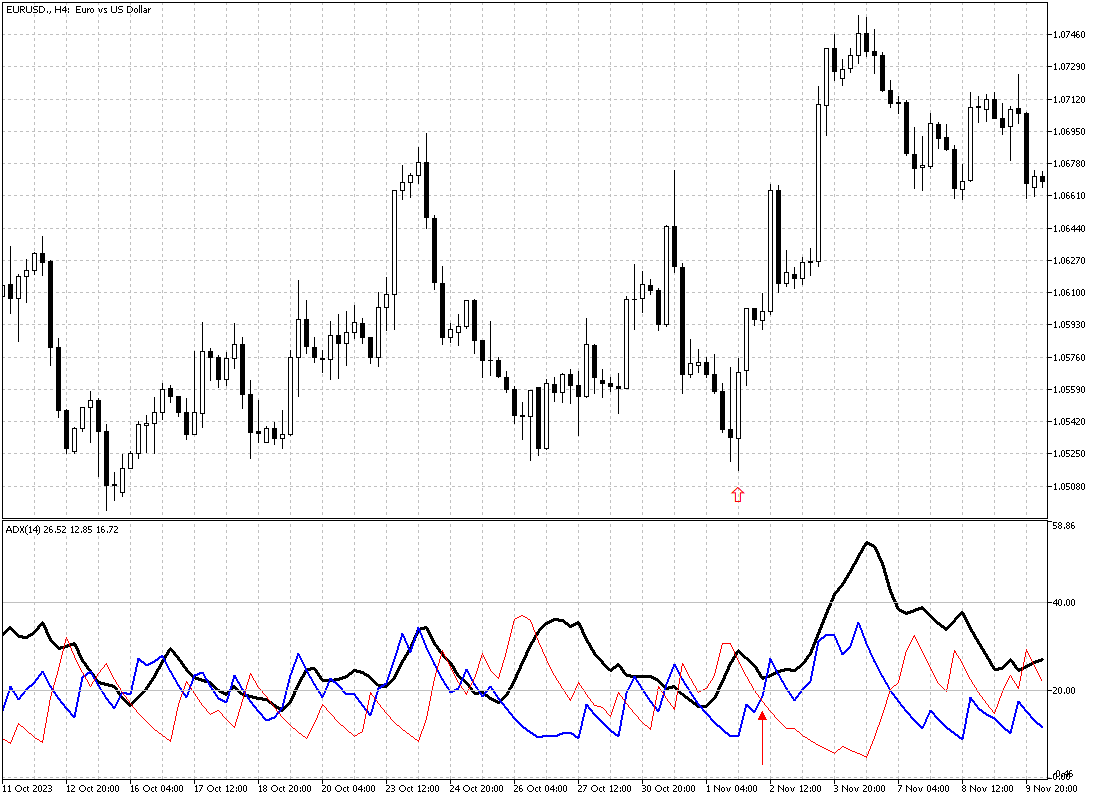
Kindly refer to the image below. In this image, the ADX line is black, while the +DI and -DI lines are blue and red, respectively. You can change the colors from the indicator’s settings.

ADX +DI Line: The +DI (Positive Directional Indicator) is part of the Average Directional Movement Index (ADX) system. The +DI mainly measures how strong prices increase, helping spot bullish trends. It compares the difference between the current high price and the previous high. If the current high is higher than the last one, the market is getting stronger positively. This difference is noted down.
A growing +DI shows that prices increase more strongly, often pointing to a bullish market. Traders use this to spot good times to buy, as a high or rising +DI can mean the uptrend will continue. However, it is best to use the +DI with its opposite, the -DI (Negative Directional Indicator), and the ADX line. The way +DI and -DI relate to each other can show the trend direction.
For example, if the +DI goes over the -DI, it’s usually a bullish sign.
Example: In the 4-hour EURUSD chart below, the ADX +DI line (in blue) crosses and rises above the ADX -DI line (in red). As soon as the +DI line hovers above the 20 level, the EURUSD price noticeably surges.

Best ADX Settings and Time Frame
Ideal ADX indicator settings can change based on the trading plan, market, and time frame. However, there are some essential tips for getting the most out of the ADX indicator.
Standard Period Setting: The ADX is often set to 14. This means it looks at the trend strength from the last 14 bars, candles, or periods, depending on the chart. This 14-period setting is popular as it balances being sensitive and reliable. Shorter periods might give faster signals but can be less accurate. More extended periods are more trustworthy but slower to react to market moves.
Threshold Levels: The ADX uses a critical level of 25 to spot strong trends. If the ADX is over 25, it shows a solid trend, up or down. A value under 20 means a weak or absent trend. Traders may tweak these levels to fit their style and the market’s ups and downs. For example, a higher level might be better to avoid small, misleading signals in a very shaky market.

Combining with +DI and -DI: The ADX works best with its related indicators, the +DI and -DI. These help tell the trend’s direction. A usual method is to watch for when the ADX is over 25 (meaning a solid trend) and the +DI and -DI lines move apart. This suggests the trend is getting stronger in one direction. Traders also look for when the +DI and -DI lines cross as a trade signal. They use the ADX to confirm if the trend is powerful.
Is the ADX Indicator helpful in Forex Trading?
The ADX can be very useful in technical analysis. However, the indicator’s accuracy depends on the market, the currency pair, and the trader’s skill. The ADX is good at showing trend strength, which is vital in the fast-changing Forex market. A high ADX (over 25) hints at a strong trend, which encourages traders to follow the trend. However, the ADX only shows how strong the trend is, not its direction. To know the trend’s direction, traders look at the +DI and -DI lines.
The ADX works best when the market has clear trends. It’s less helpful in markets that don’t show a clear direction. Traders must watch out for delayed signals, a common issue with trend-following tools like the ADX.
Forex traders often pair the ADX with other methods, like moving averages or the Relative Strength Index (RSI), to get a fuller market picture. The ADX helps confirm whether a trend is reliable or a trend reversal is building up. Traders must tweak the ADX settings to fit the specific currency pairs and their volatility.
Using the ADX well in Forex trading means understanding and integrating it into a broader strategy. This strategy should consider the market, risk management, and the trader’s style. The ADX isn’t perfect. It’s one of many tools in a diverse Forex trading strategy.
ADX Day Trading Strategy: A Combination of Robust Tools
Combining the ADX indicator with other tools is wise, as it allows traders to filter out false signals. In this trading strategy, I will be using four indicators:
- ADX Indicator
- Ichimoku Cloud
- Stochastic Oscillator
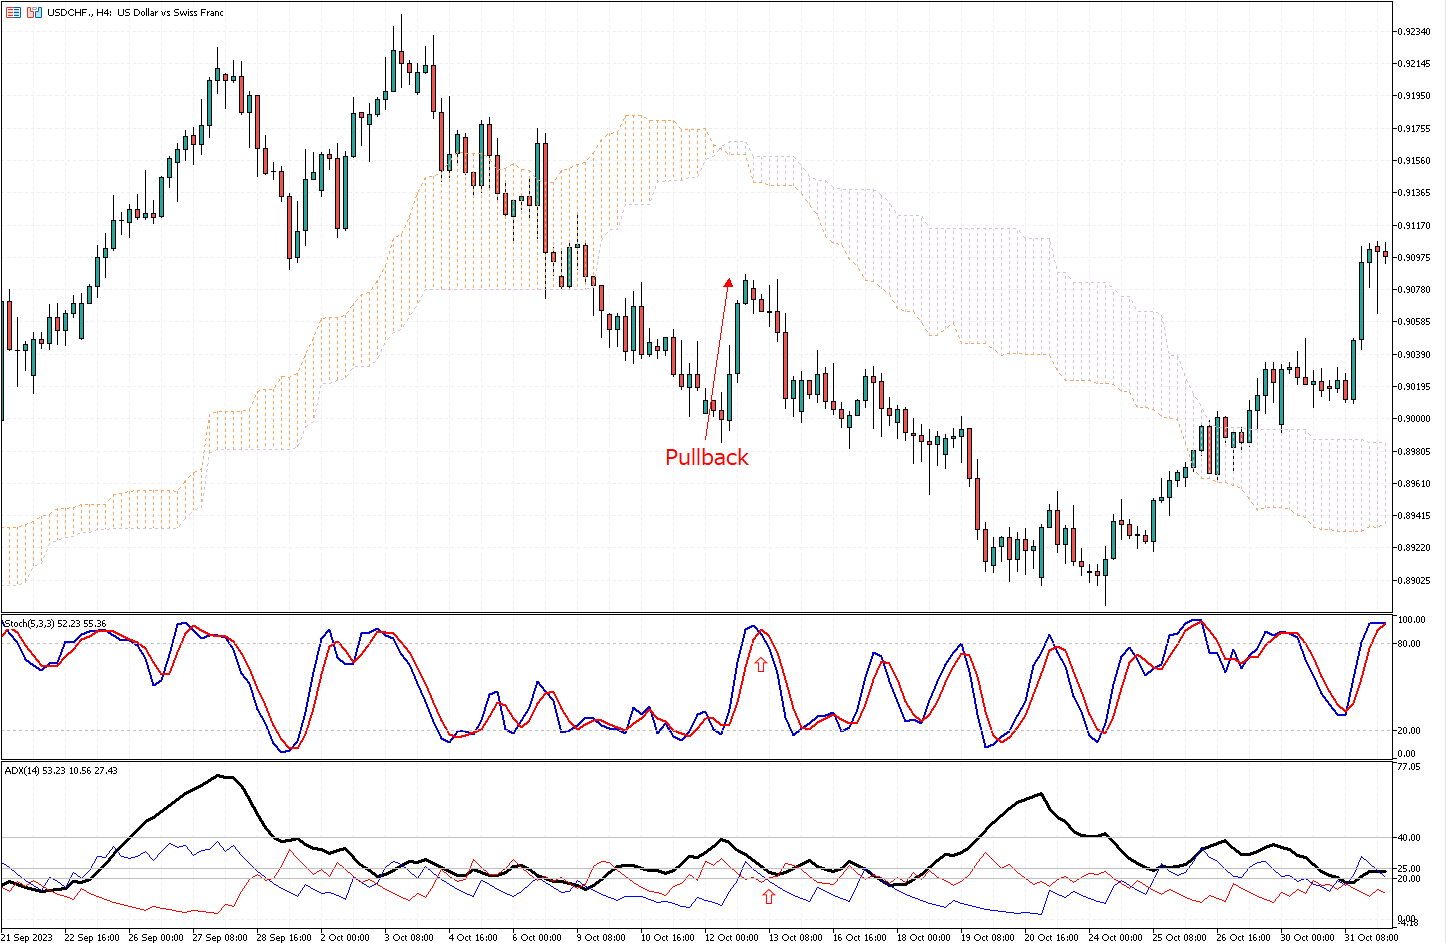
I’ve named this strategy ‘A.S.I.’ The ‘A’ stands for the ADX indicator, ‘S’ represents the Stochastic Oscillator, and ‘I’ denotes the Ichimoku Cloud. I am using the default settings for all three indicators. However, I’ve changed the colors of the indicators for better representation on the chart. The time chart should be the 4-hour frame, as technical indicators perform best in this period.

To buy a security using the A.S.I strategy, you should follow the rules outlined below:
- The security must be above the Ichimoku Cloud.
- Wait for a pullback to the Ichimoku Cloud.
- The Stochastic Oscillator lines should step outside the oversold area.
- The ADX line must hover above the 20 level.
- The ADX +DI line must cross above the ADX -DI line and above the 20 level.
We can execute a trade once all the conditions on a security chart are met. The stop loss should be set below the Ichimoku Cloud.
For a sell signal, the terms are the same but in reverse.

- The security must be below the Ichimoku Cloud.
- Wait for a correction to the Ichimoku Cloud.
- The Stochastic Oscillator lines should step outside the overbought area.
- The ADX line must hover above the 20 level.
- The ADX -DI line must cross above the ADX +DI line and the 20 level.
I hope you enjoyed reading this article. If you have any questions or opinions, please share them with me.