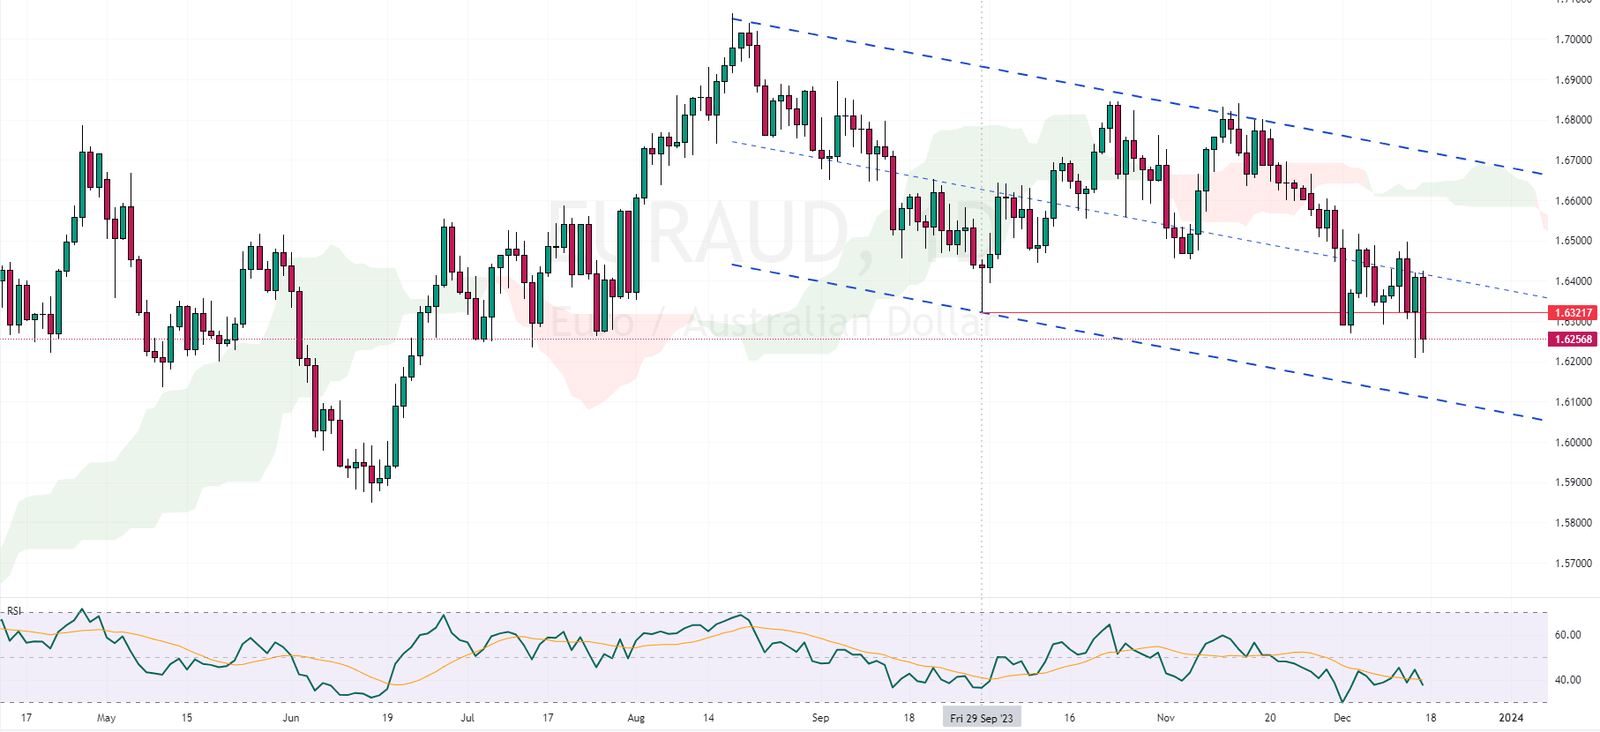
FxNews—In today’s comprehensive EURAUD forecast, we will first scrutinize the current economic conditions in Australia. Then, we will meticulously delve into the details of the technical analysis of the EURAUD pair.
S&P/ASX 200 Hits Peak; Mining, Energy Soar
Bloomberg—On Friday, the S&P/ASX 200 Index experienced a significant rise, reaching its highest point since early August with a 0.88% increase and closing at 7,443. This surge was primarily driven by the robust performance of the mining and energy sectors, fueled by stronger commodity prices. Australian stocks echoed the upward trend in Wall Street, following the Federal Reserve’s indication of potential interest rate reductions in 2024.
In the domestic sphere, the Australian labor market showed signs of cooling, prompting speculation that the Reserve Bank of Australia might halt its tightening measures and consider future rate cuts. Leading the charge in the mining and energy sectors were prominent companies like BHP Group, Rio Tinto, Fortescue Metals, Pilbara Minerals, Woodside Energy, and Santos, with notable gains. Central finance, technology, and consumer players also saw advances.
EURAUD Forecast – Bears in Control What’s Next?
FxNews – The EURAUD currency pair recently closed below its late September low, specifically at the 1.6321 mark. The RSI (Relative Strength Index) indicator remains below 50, indicating potential continued weakness.
Additionally, the EURAUD is trading within a bearish channel. Analysis of the daily chart and technical indicators suggest continuing this bearish trend. The median line of the channel acts as a key resistance point. With the EURAUD price lingering below this resistance, there’s an expectation that the selling pressure might push the price down to the channel’s lower boundary.

However, it’s essential to consider the alternative scenario. If the bulls close the price above the median line and stabilize it there, it would challenge the current bearish outlook. In such a case, the EURAUD price could potentially test the upper band of the flag pattern. The Ichimoku cloud also reinforces this resistance area, adding an extra layer of technical significance.
Overall, while the current trend leans towards bearishness, traders should be mindful of the potential for a shift in momentum, especially if the price breaks above the median line.