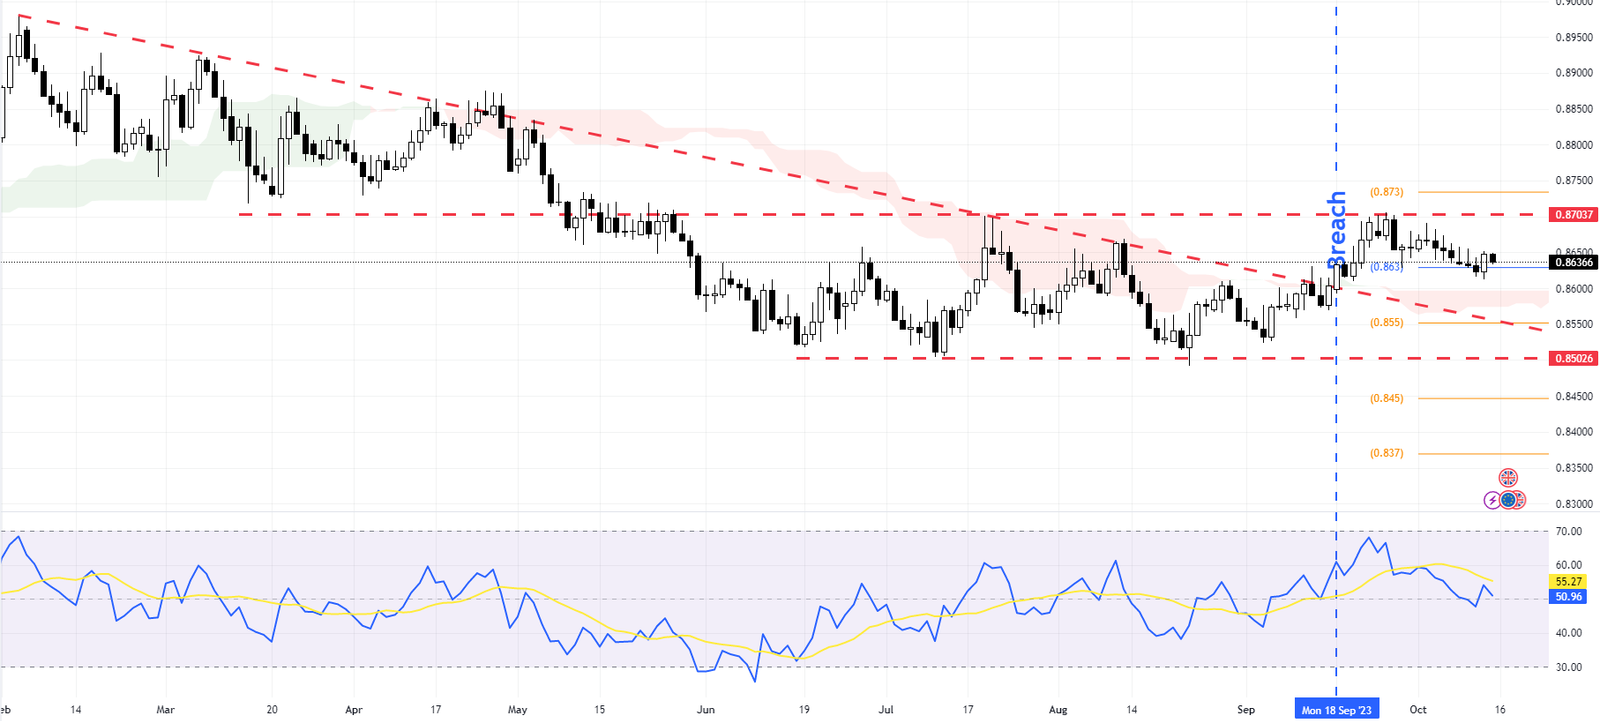
In our latest EURGBP forecast, we’ve observed some interesting trends. The EURGBP currency pair, a key indicator in forex trading, broke the bearish trendline on September 18, as shown in the daily chart. This is a significant development as it indicates a potential shift in market sentiment.

EURGBP Analysis: Technical Analysis
For those new to forex trading, a bearish trendline is drawn above the price to illustrate resistance levels. When prices break through this line, it’s often seen as a bullish signal, suggesting that prices may continue to rise.
However, the bullish bias seemed to halt after it hit the first target at 0.8703. The bulls failed to close above the 0.8703 resistance, leading to continued sideways movement in the EURGBP. Resistance levels are prices at which sellers are expected to enter the market sufficiently to take control of buyers.
The Relative Strength Index (RSI), another crucial tool in market analysis, closed below the 50 line. The RSI is a momentum oscillator that measures the speed and change of price movements. Traditionally, readings over 70 are considered overbought, and readings under 30 are considered oversold. However, a reading below 50 in trending markets can indicate that the downtrend is in good health and likely to continue.
Given these factors, it’s likely that the value of EURGBP will decline and test the 0.855 level.

Zooming into the EURGBP 4-hour chart, we can see that the currency pair is trading within a bearish channel and is currently below both the Ichimoku cloud and the pivot point. The Ichimoku cloud is a collection of technical indicators showing support and resistance levels, trend direction, and momentum.
With a hold below the pivot point (0.8655), our EURGBP Analysis suggests that the currency pair may target 0.86 followed by 0.856.
In conclusion, this EURGBP Analysis suggests potentially continuing the bearish trend unless key resistance levels are broken.