Bloomberg–The Bank of Japan has not confirmed its involvement in the yen’s brief uptick this week. The top currency official, Masato Kanda, mentioned that outcomes will be shared at the end of next month. He also noted that they are ready to act in the forex market if necessary.
Yen Response to BoJ Tactics
Additionally, there are talks that Japan might offer tax incentives to companies that convert their profits back to yen. This year, the yen has fallen over 10% against the dollar because the Bank of Japan maintains very low interest rates. This policy encourages traders to borrow yen and invest in higher-return currencies.
EURJPY Forecast: Bears Test the Bullish Channel

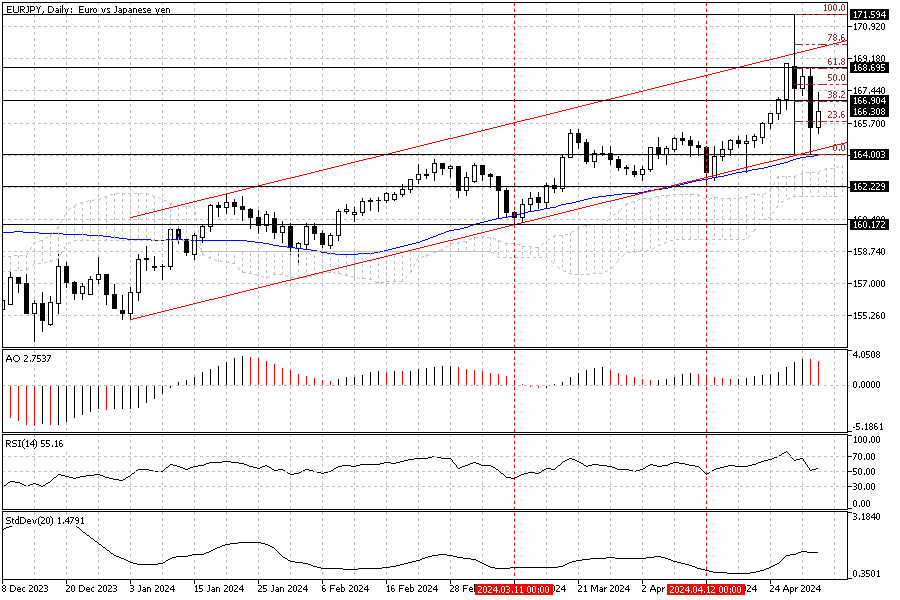
FxNews—The European currency fell to EMA 50, the 164.0 mark, against the Japanese Yen on Wednesday after the pair peaked at 171.5. The 164.0 mark is in conjunction with the lower line of the bullish channel, as shown in the daily chart below. This resistance area is further supported by the Ichimoku cloud, which made this demand area more powerful.
EURJPY 4-Hour Chart: An Analysis of the Bullish Trend

Zooming into the 4-hour chart gives us a closer look at the price movement. As of writing, the EURJPY pair trades at about 166.4 and couldn’t stabilize itself above the 38.2% Fibonacci level. Considering the bullish primary trend, the euro will likely return, and the uptrend will resume.
EURJPY Eyes Bullish Target at 168.6
However, for the bullish trend to resume, the EURJPY should close and stabilize itself above the Fibonacci resistance level, the 166.9 mark, as mentioned earlier. If this scenario comes into play, the bulls’ next target would be 168.6, which coincides with the 61.8% Fibonacci retracement level.
- Also read: EURJPY Technical Analysis – January-10-2024
EURJPY Bearish Scenario
Conversely, the April 12th low, 162.2, is the main resistance to the uptrend. This resistance is shown in the EURJPY daily chart. Should this level be breached, the bullish technical analysis should be canceled. The decline that began yesterday will likely extend to 160.1, March’s lowest point.