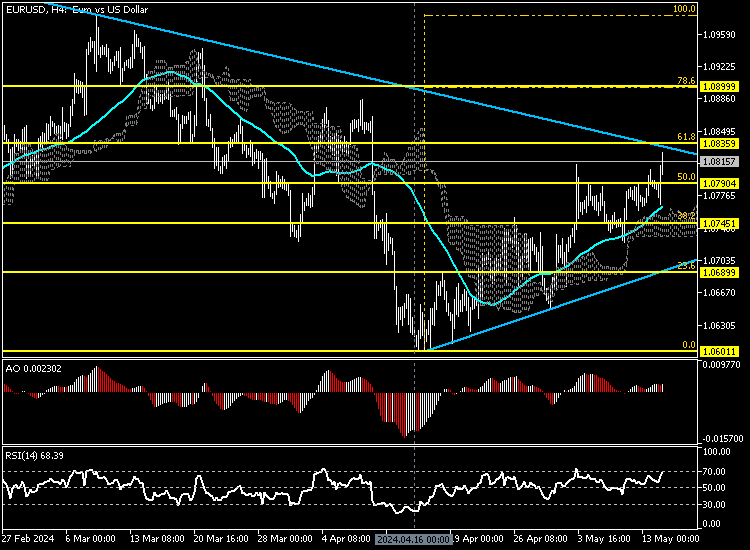
FxNews—The European currency has been in an uptrend against the U.S. dollar since April 16, when it began rising from the 1.060 mark. The bulls added significant buying pressure in today’s trading session, driving the price above the EMA 50.
As of this writing, the EURUSD pair trades at about 1.081, but it is still below the descending trendline and close to the 61.8% Fibonacci retracement level. The daily chart below demonstrates the situation of the Euro against the U.S. dollar.

EURUSD Technical Analysis – Uptrend Cools Down
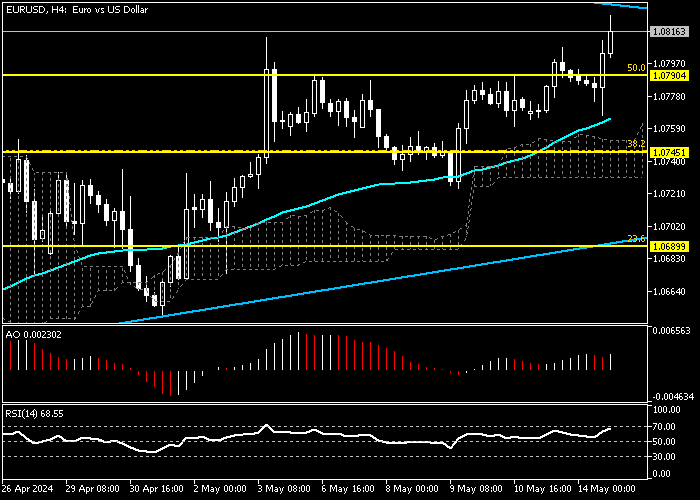
The 4-hour chart below provides a closer look at the price movement. As shown in the image, the bulls are stabilizing the price above the 1.079 mark, a minor support in conjunction with the 50% Fibonacci.

When writing, the uptrend momentum has eased near the 1.083 mark, a significant barrier supported by the descending trendline and the 61.8% Fibonacci. Amid the uptrend cooling down, the awesome oscillator signal divergence and the relative strength index value show 69, ready to step into the overbought area.
These developments in the technical indicators suggest that the trend might reverse or step into a consolidation phase.
EURUSD Forecast – Correction Phase on the Horizon

From a technical standpoint, the primary trend is bullish, but the uptrend is cooling down as it gets closer to the 1.0835 resistance. With the AO divergence signal, the U.S. dollar will likely erase some losses if the price remains below 1.0835. In this scenario, the %38.2 Fibonacci can be the initial seller’s target, followed by the lower band of the ascending trendline, the 1.0689.
The Bullish Scenario

On the flip side, for the uptrend to continue, the bulls must close and stabilize the price above the robust barrier of 1.0835. If the Buyers develop this scenario, the EURUSD price path to 1.083 (78.6% Fibonacci retracement level) will be paved.
EURUSD Key Support and Resistance Levels
Traders and investors should closely monitor the key levels below to make informed decisions and adjust their strategies accordingly in market shifts.
- Resistance: 1.083, 1.089
- Support: 1.074, 1.068