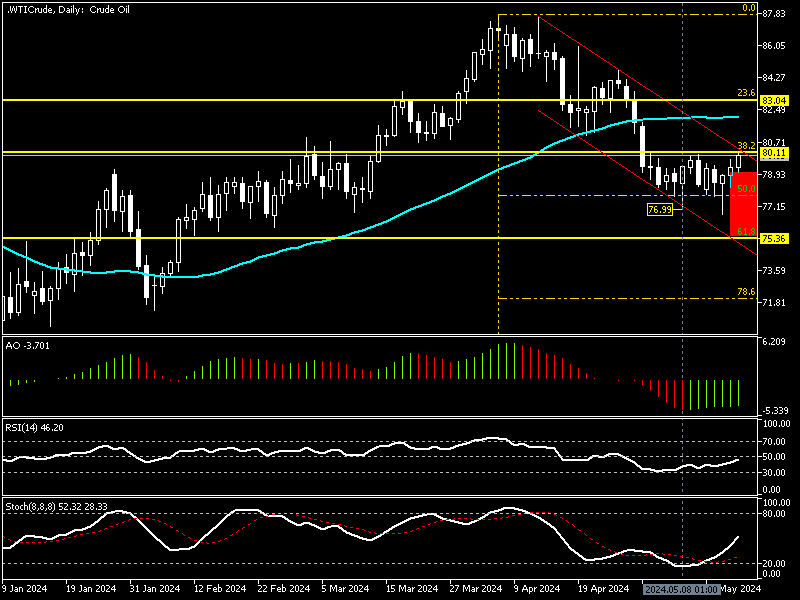
FxNews—Black gold is having a pullback after its price dipped to as low as $76.9 per barrel against the U.S. Dollar on May 8. The uptick momentum surged the price to 38.2% Fibonacci level. Consequently, the bulls closed the Crude Oil ended the week at $79.9 per barrel on Friday.
Crude Oil Technical Analysis – Daily Chart
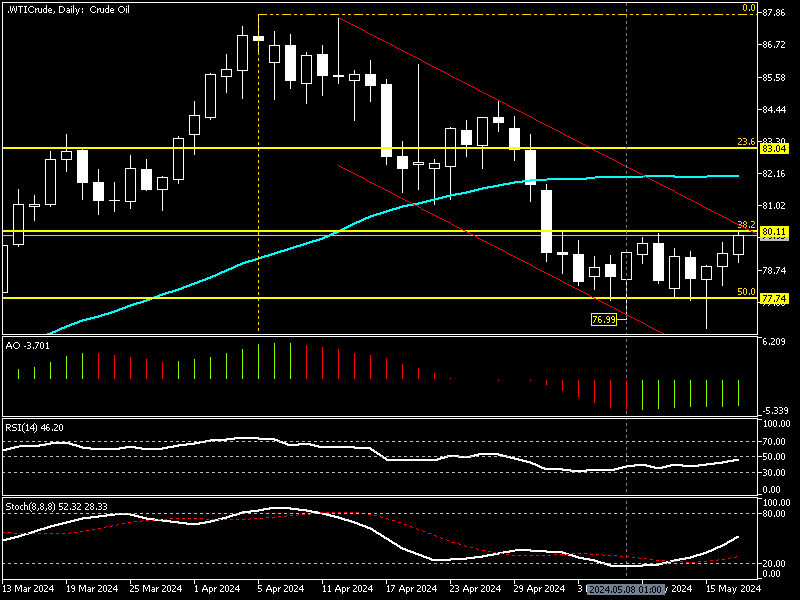
The technical indicators signal bullish momentum, with the awesome oscillator bars in green but hovering below the signal line. The relative strength index value is 46.2, approaching the median line, and the stochastic oscillator returned from the oversold area, demonstrating 28.3 in the description.
These developments in the technical indicators in the daily chart suggest that the bullish momentum initiated from 76.9 could resume. Therefore, we zoom into the WTI Crude Oil 4-hour Chart to conduct a detailed analysis and find key levels and trading opportunities.
Crude Oil Technical Analysis – 4-HourChartt
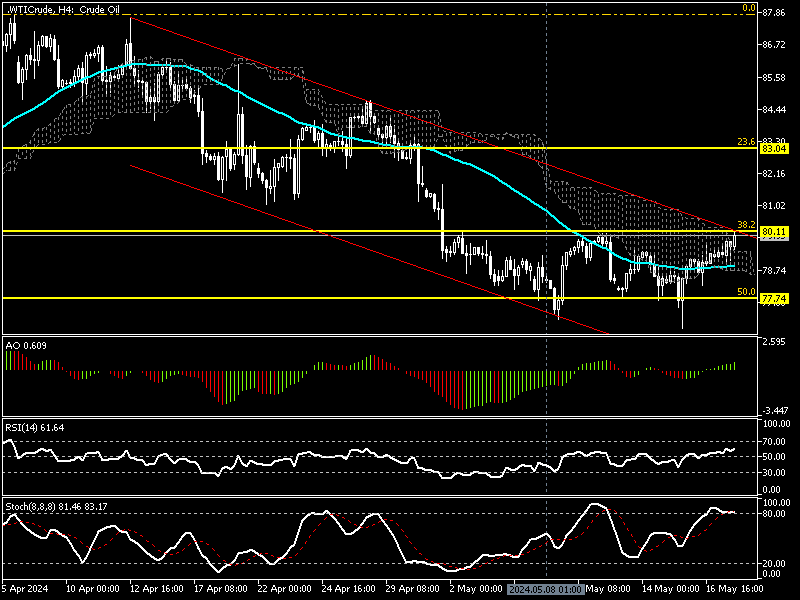
The 4-hour chart provides exciting information on Oil price movements. The WTI Crude traded in a bearish channel and tested the 38.2% Fibonacci ($80.1) resistance level in conjunction with the descending trendline.
The technical indicators in the 4-hour chart provide mixed signals. The RSI value is 61.6, promising a continuation of the momentum from $76.9. The awesome oscillator bars are green and above the signal line, with a value of 0.60 in the description.
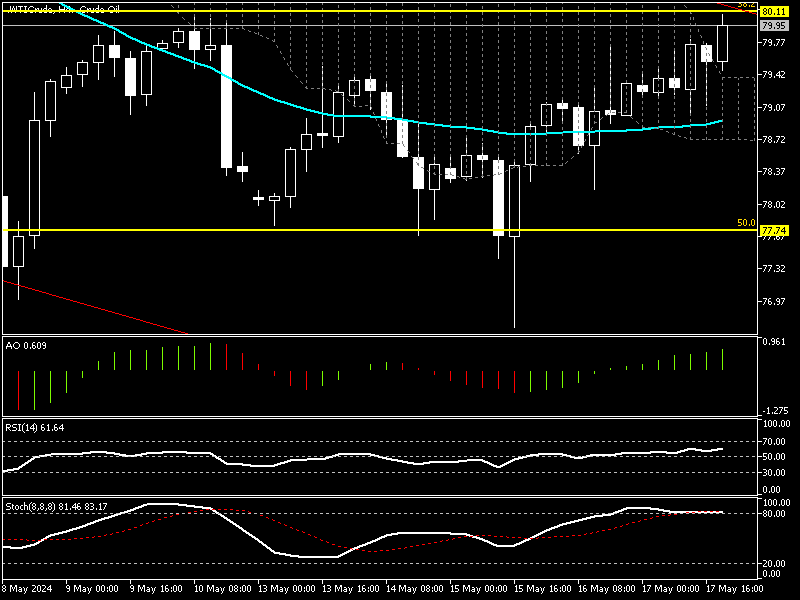
We have two more indicators that give intriguing cues of what could be the next market move. The stochastic oscillator value is 83.7, which shows an overbought market. On the other hand, the bulls crossed above EMA 50 and the Ichimoku cloud, a signal that aligns with AO and RSI on both daily and 4-hour charts.
These 4-hour chart technical tools developments can be interpreted as Crude Oil in a short-term bull market. Still, traders and investors should approach the uptrend cautiously because the stochastic oscillator signals an overbought market.
WTI Crude Oil Buyers Confront $80 Resistance
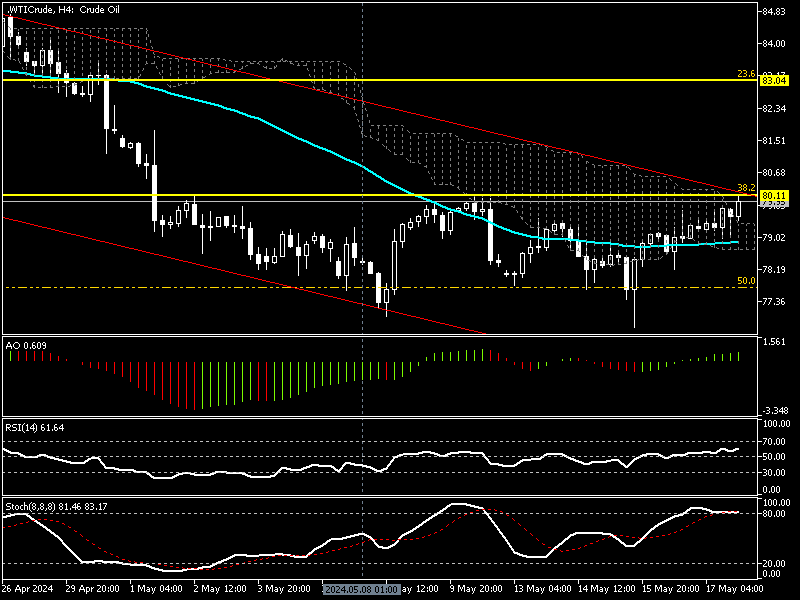
From a technical standpoint, WTI Crude Oil is in a bull market facing the 80.1$ resistance, a demand zone backed by a descending trendline. The price must close and stabilize above the resistance for the bullish momentum to resume. If this scenario comes into play, the surge that began on May 8 could expand and target the $83.0 (23.6% Fibonacci Resistance level).
The Bearish Scenario
The stochastic oscillator floats in the overbought zone. This could lead to the Oil price dipping. If the sellers maintain a position below the 38.2% Fibonacci (the $80.1 mark), considering the primary trend is bearish, the market could decline to EMA 50, the $78.0 mark.
If the bears close below EMA 50, the downtrend will likely target the 61.8% Fibonacci, the $75.0 mark.