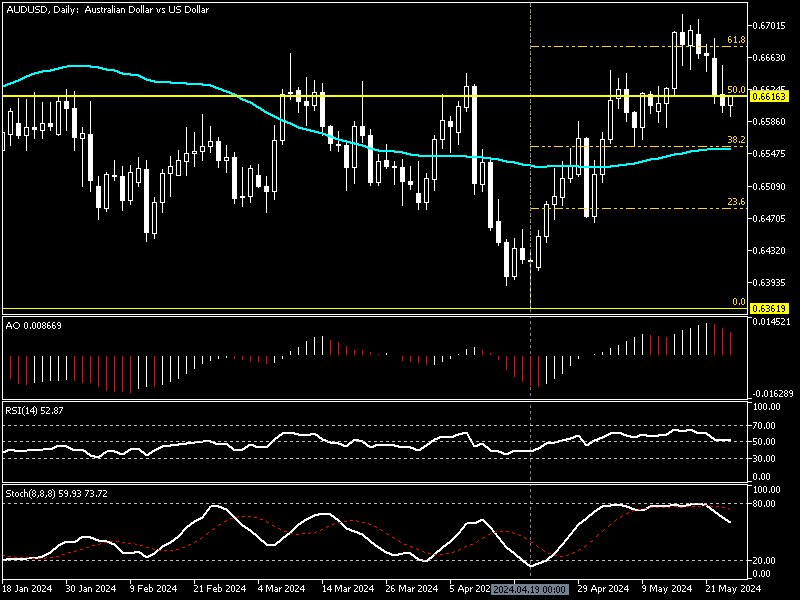
AUDUSD Technical Analysis—In today’s trading session, the Australian dollar traded at about $0.661 against the U.S. Dollar, stabilizing the price below the 50 Fibonacci retracement level at $0.661.
AUD/USD Technical Analysis Daily Chart

FxNews—The daily chart above shows the pair’s price hovering below the Fibonacci level mentioned earlier in this post, while the AO and RSI signal continuation in the downtrend.
- The awesome oscillator value is 0.008 now. The bars are in red, and the value decreases toward the zero line. This signifies a reduction in the momentum of the current trend. In addition, when AO’s value declines, this development means the downtrend will likely resume.
- The relative strength index (RSI 14) shows a value of 52 in the description, clinging to the middle line. That means the trend is neutral; it is neither overbought nor oversold. If the position of the RSI drops below 50, the downtrend can escalate.
- The stochastic oscillator’s %K line value is 59, turning downside, demonstrating the trend’s bearish bias.
In conclusion, the daily chart’s AUD/USD price behavior and technical indicators (awesome oscillator, RSI, and Stochastic) suggest the currency pair is in a bear market. The current uptick momentum can be considered a consolidation phase.
AUD/USD Technical Analysis 4-Hour Chart

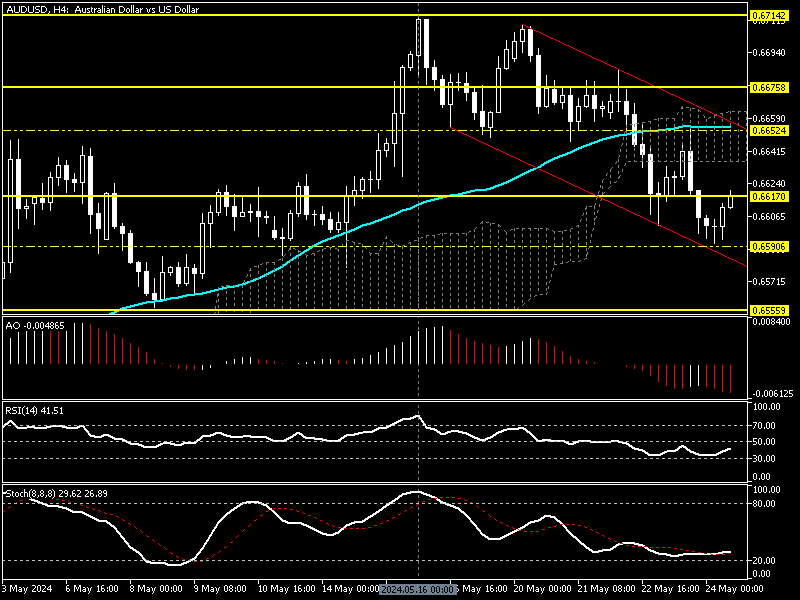
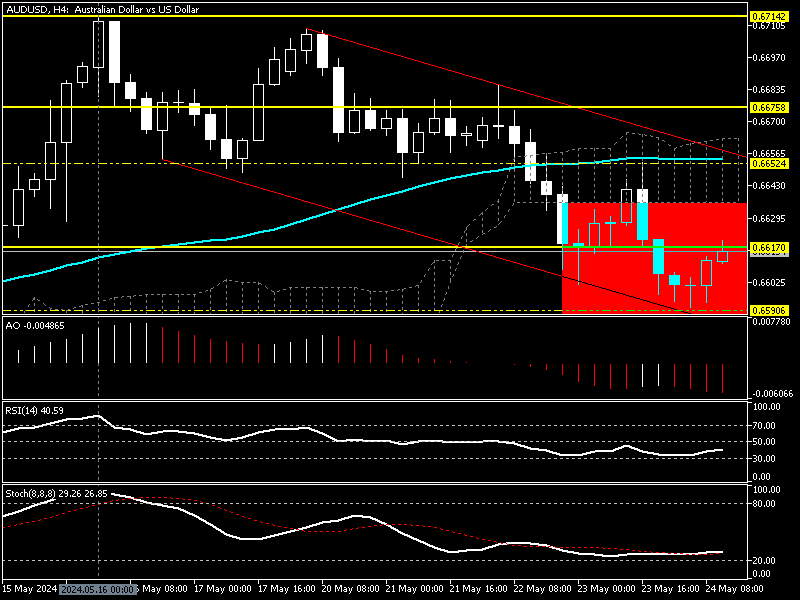
The 4-hour chart provides valuable information. The image above shows that the AUD/USD pair is in a downtrend in the bearish flag. Today, a doji candlestick pattern close to the descending trendline at $0.659 was found. The doji indicates that the price might bounce and test the broken EMA 50 as a resistance area at $0.665.
- EMA 50 (exponential moving average) is a technical tool that assists traders in finding vital supply and demand areas. When a security’s price is above EMA 50, the indicator’s line is considered a supply area; therefore, when the market dips below it, EMA 50 shows the demand area in strategies based on technical analysis.
The stochastic oscillator and RSI (14) support the speculations emerging from the doji candlestick pattern. The relative strength index value is rising but still below zero, recoding 41, and the Stochastic oscillator value is gradually increasing, showing 29 in the %K line.
- A Doji candlestick pattern suggests an indecision market and potential reversal point. RSI rising toward the middle line aligns with the doji candlestick pattern because as RSI gets closer to the 50 line, it signals the market does not have a clear trend.
These developments in the technical indicators in the 4-hour chart suggest the AUD/USD price can trade sideways with a weak uptick momentum from the $0.659 mark.
Key Insights from Daily and 4-Hour AUD/USD Analysis

According to the daily chart, the AUD/USD currency pair is in a downtrend from $0.671, and the bears are trying to stabilize the price below %50 Fibonacci retracement level at $0.661. The technical indicators in the daily chart suggest a continuation of a downtrend, but the same indicators in the 4-hour chart suggest a weak pullback.
AUDUSD Forecast – Potential Rise to Resistance at 0.665

Therefore, from a technical perspective, the Australian dollar will likely erase some of its recent losses against the U.S. Dollar by rising to the immediate resistance of 0.6652 (EMA 50). This level of resistance, which coincides with the Ichimoku cloud, EMA 50, and the upper line of the bearish flag, can provide a reasonable demand price for traders and investors to join the downtrend.
If this scenario occurs and the price remains below $0.6652, the downtrend will likely resume and expand to the lower support areas. The 38.2% Fibonacci retracement level at $0.655 can be the next target for the U.S. Dollar.
Factors That Nullified the Bearish Scenario

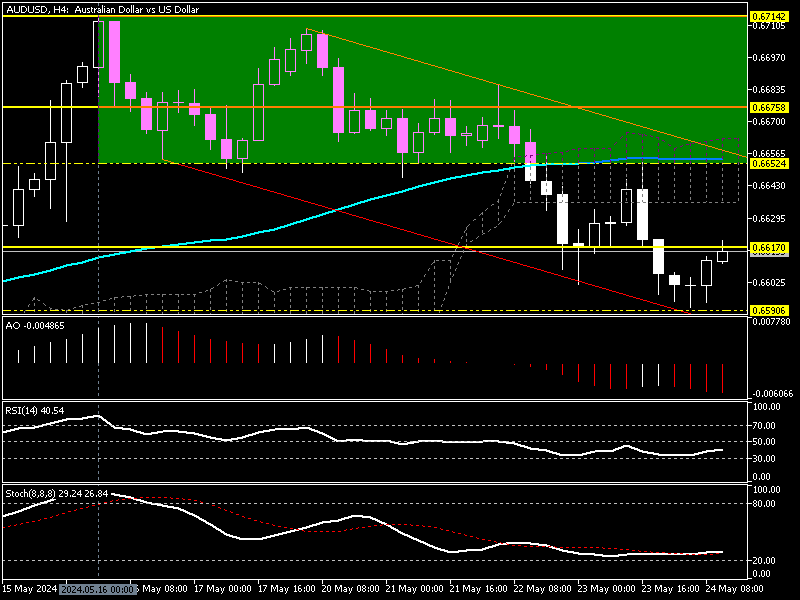
On the flip side, if the bulls cross above EMA 50 at 0.6652, the bearish scenario should be invalidated, and the uptick momentum began today from $0.659 can target 61.8% Fibonacci at $0.667, followed by a May 16 peak at $0.671.
AUD/USD Key Support and Resistance Levels
Traders and investors should closely monitor the USD/CHF key levels below to make informed decisions and adjust their strategies accordingly as market conditions shift.
- Support: $0.659, $0.6555
- Resistance: $0.6617, $0.6652, $0.667