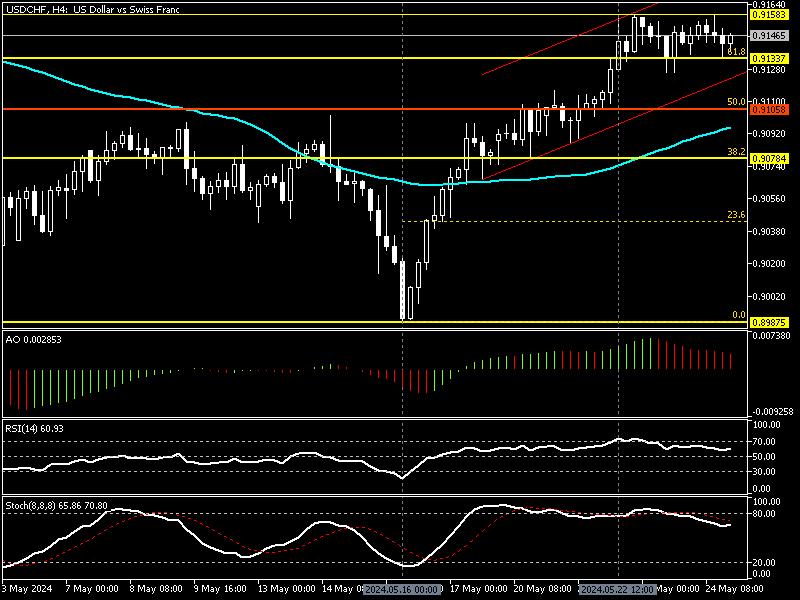
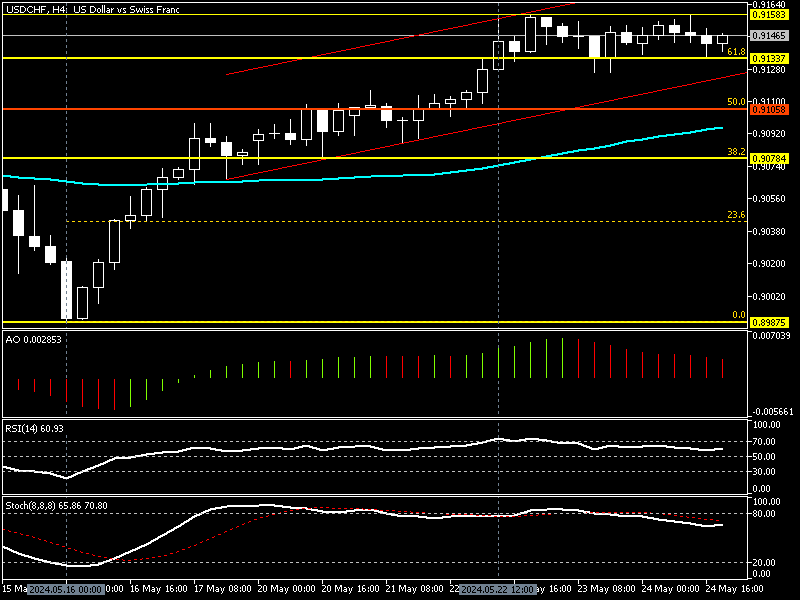
FxNews—The U.S. Dollar closed the trading week at 0.914 against the Swiss Franc. The USD/CHF 4-hour chart below shows the currency pair is in a bull market, but it has been ranging sideways from 0.9133 (immediate support) to 0.9173 (immediate resistance) since May 22.

USD/CHF Technical Analysis 4-Hour Chart
The market’s sideways momentum suggests the uptrend that began on May 16 has eased, and traders await the price to make a new breakout from one of the key levels below.
- Key support level: 0.9133
- Key resistance level: 0.9158
These key levels assist investors in planning their risk management. For instance, if the bulls break above the key support level at 0.9133, the stop loss should be set at the key resistance level at 0.9158.

The technical indicators in the four-hour time frame also suggest a slowdown in the bullish momentum. The awesome oscillator value drops with red bars, showing 0.0028 in the description, signifying that the bullish trend is tiring.
The relative strength index indicator was in overbought territory, and as of this writing, the indicator value has declined to 60, showing 60 in the description. This decline in the RSI reveals that the USD/CHF uptrend is slowing.
The Stochastic oscillator value also drops, with the %K line period floating below 80 at 65, suggesting a slowdown in the trend.
These developments in the technical indicators suggest the USD/CHF uptrend eased, and the market stepped into a consolidation phase. It is essential to mention that when a trading asset is in a sideway market, traders and investors should wait for a bullish or bearish breakout and join the new wave after the breakout.
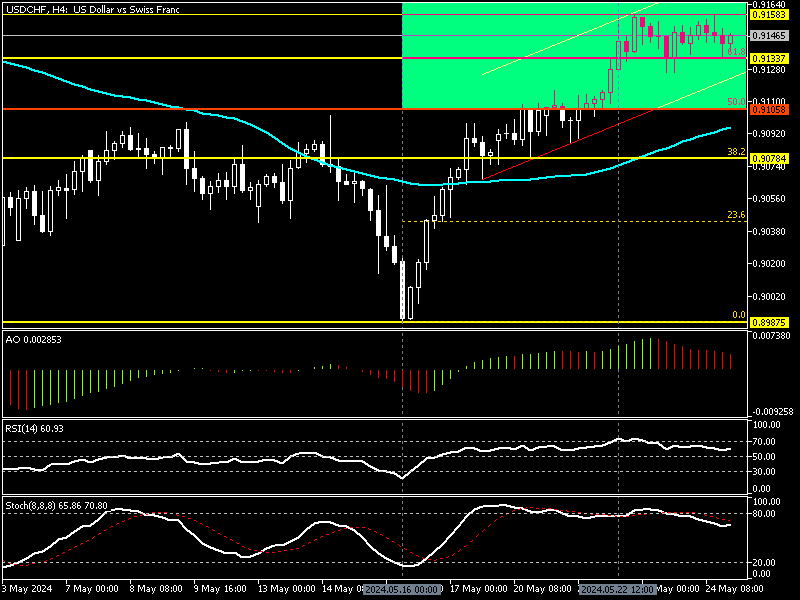
USDCHF Forecast – Bullish Resumes Above 0.915

From a technical standpoint, despite the current low momentum, in a bigger picture, the primary trend is bullish, with the key support level at 61.8% and the Fibonacci retracement level at 0.9133. The uptrend will likely resume if bulls close above the key support level at 0.9158. If this scenario comes into play, the next bullish target could be the 78.6% Fibonacci at 0.917, followed by April’s all-time high at 0.922.
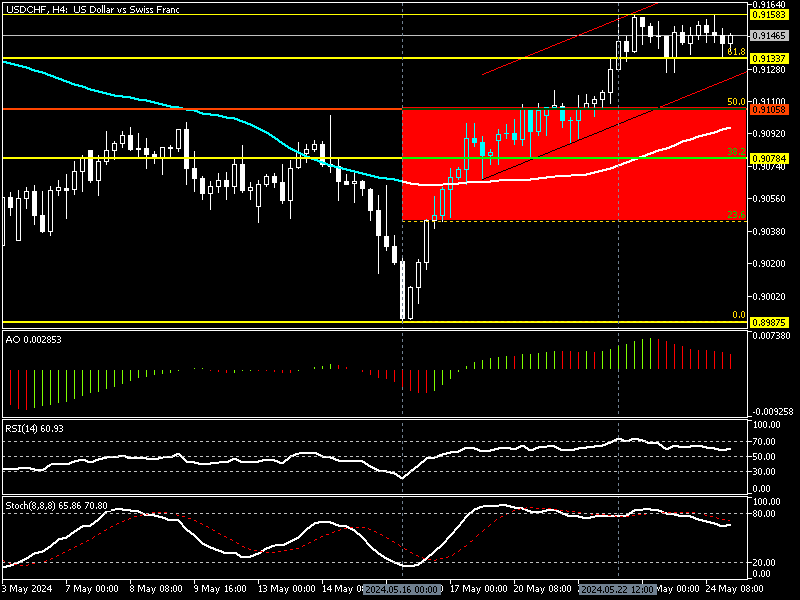
USD/CHF Bearish Scenario

Conversely, the 50% Fibonacci retracement level at 0.9105 plays a pivotal role between the bull and the bear markets. The bullish scenario should be invalidated if the USD/CHF price dips below the pivot, a robust resistance level backed by EMA 50. If this scenario comes into play, the consolidation phase could extend to the 38.2% Fibonacci retracement at 0.9078.