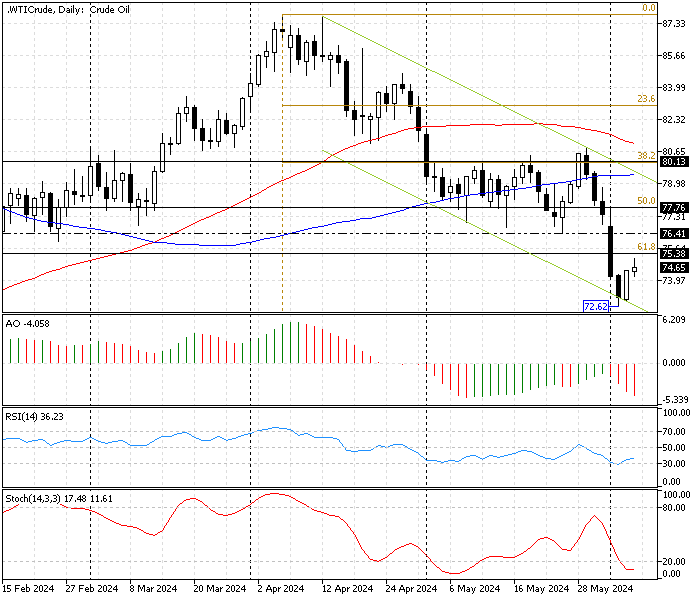
FxNews—Crude Oil bounced from the lower band of the bearish flag at $72.6. This decline in the price was expected because the stochastic oscillator is in the oversold territory, as shown in the WTI Crude Oil daily chart below. Interestingly, the relative strength index also stepped outside the oversold area, justifying today’s pullback.
As a result, Oil is testing the 61.8% Fibonacci resistance level at $75.3.

Crude Oil Technical Analysis – 6-June-2024
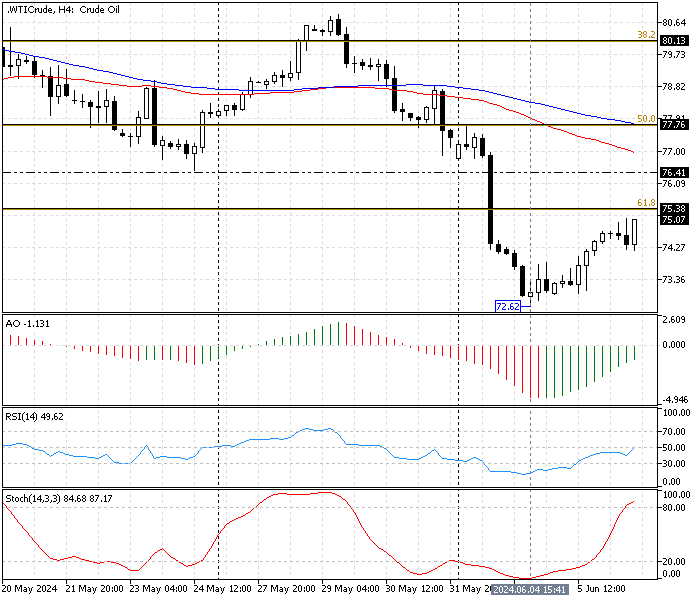
The yellow metal formed a long wick candlestick pattern in the 4-hour chart, while the stochastic was in overbought territory. This could mean the Oil price is overpriced in the short term, and the market might reverse or consolidate.

- The awesome oscillator bars are green but below zero. The AO value is -1.13 and increasing, which means the bearish momentum is weakening.
- The relative strength index indicator value is 44, below zero but approaching the middle line. This means the market is losing momentum with mild bullish tendencies.
- These developments in the technical indicators in the Gold 4-hour chart suggest that despite the bullish beginning from $72.6, the momentum and Oil are overpriced in the short term.
Crude Oil Price Forecast – 6-June-2024

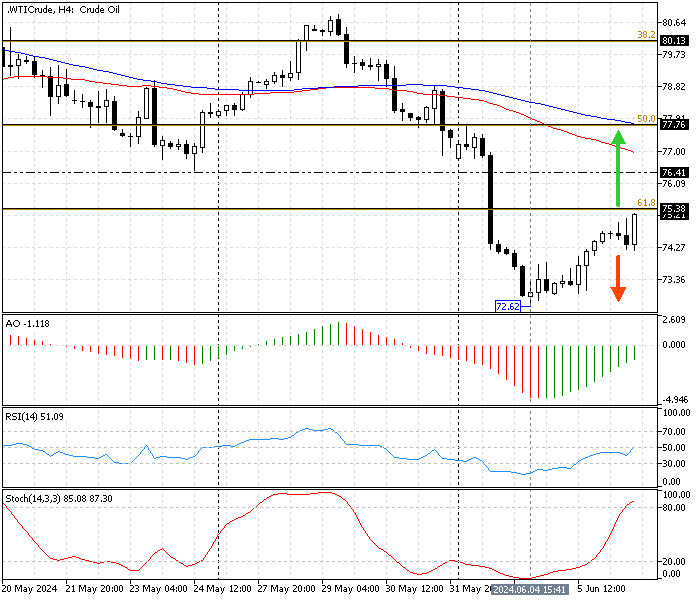
The key resistance is at 61.8% Fibonacci at $75.3, and the technical indicators suggest the bullish momentum is easing and the Oil might be overpriced. In addition to the technical indicators, the 4-hour chart formed a bearish longwick candlestick pattern.
The primary trend is bearish because the pair trades inside the bearish flag, as depicted earlier in the daily chart. Hence, from a technical standpoint, as long as the bears hold the Oil price below the key resistance at $75.3, the bearish outlook will remain valid.
In this scenario, the market could target the June 4 low at $72.6 again. If selling pressure exceeds this level, the 78.6% Fibonacci at $71.9 could be the next bearish target.
Bullish Scenario
The primary trend is bearish, and the upper band of the bearish flag plays the pivot between the bull and the bear market. But if the oil price crosses and stabilizes above the 61.8% Fibonacci at $75, the uptick momentum that began on June 04 could test the 50 Fibonacci level at $77.7, backed by the simple moving average of 100.
- Next read: Crude Oil Technical Analysis – 11-June-2024
WTI Crude Oil Key Support and Resistance Levels
Traders and investors should closely monitor the key levels below to make informed decisions and adjust their strategies accordingly as market conditions shift.
- Support: $72.6 / $71.9
- Resistance: $75.3 / $77.7 / $80.1