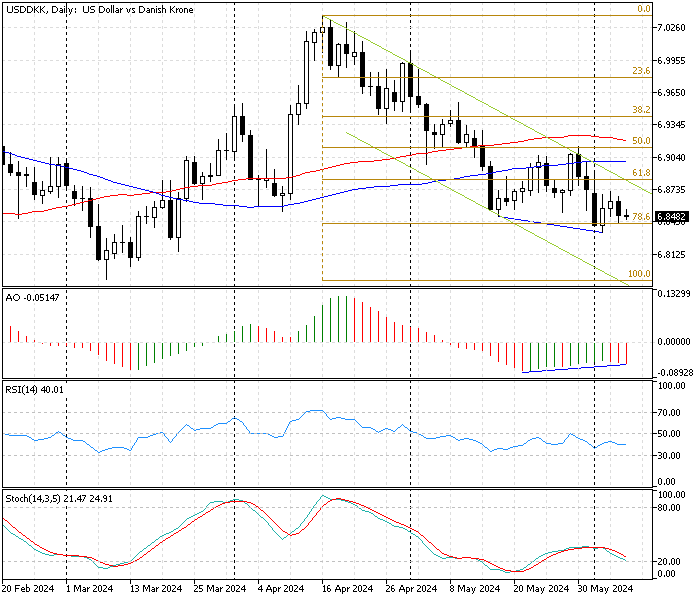
FxNews—The American currency traded at about 6.84 against the Danish Krone in today’s trading session. As depicted in the USD/DKK daily chart below, the pair ranges inside the bearish flag, which indicates the primary trend is bearish.
Interestingly, the awesome oscillator in the daily chart signals divergence, which can be interpreted as the market stepping into a consolidation phase or the trend may reverse. The RSI and the stochastic oscillator in the daily chart suggest bearish momentum. The image below shows the bearish flag, Fibonacci levels, and technical indicators in the USD/DKK daily chart.

USDDKK Technical Analysis – 7-June-2024
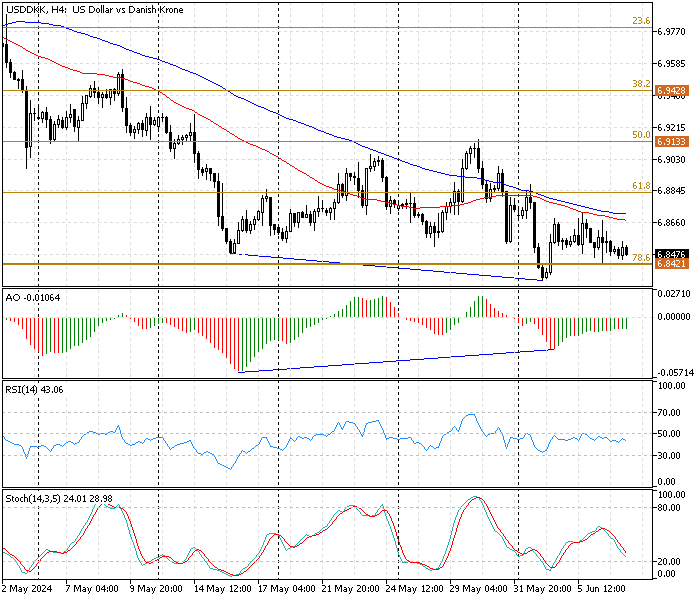
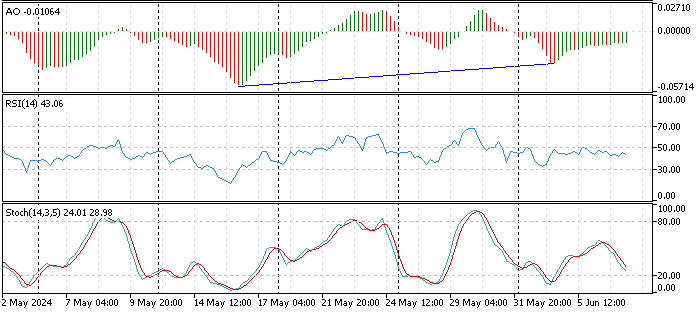
The awesome oscillator also signals divergence in the 4-hour and daily charts. The recent AO bars turned green, and the value is rising, approaching the signal line. This growth, concurrently with divergence in the indicator, means the USD/DKK could enter a consolidation phase, and the U.S. Dollar might erase some of its recent losses against the Danish Krone.

- The relative strength index indicator value is 43, below zero, moving alongside the median line. This behavior in the RSI 14 line means the market is moving sideways and lacks momentum but is mildly bearish.
- The Stochastic oscillator value is declining, showing 28, signifying a bearish trend and a possible further dip in the USD/DKK price.

These developments in the technical indicators in the USD/DKK 4-hour chart suggest the bearish market is losing momentum, and the trend might consolidate or reverse.
USDDKK Forecast – 7-June-2024

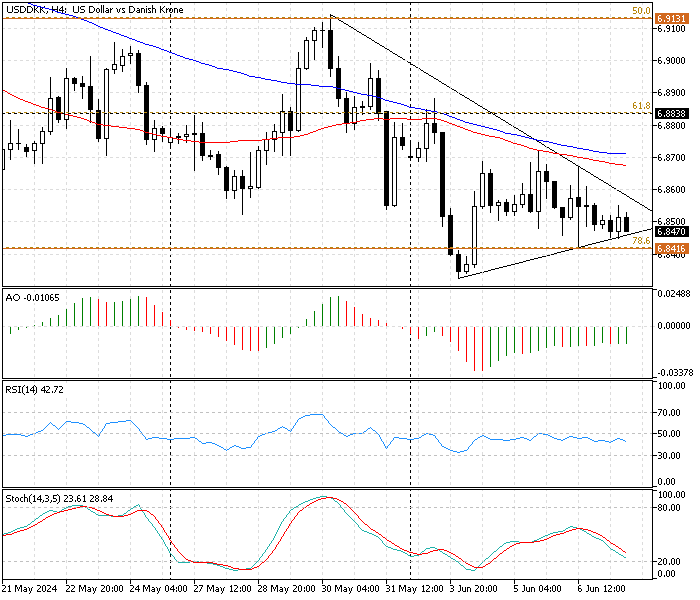
The 4-hour chart above shows the price approaching the apex of the symmetrical triangle, and bears are currently testing the ascending trendline. From a technical standpoint, if the USD/DKK dips below the ascending trendline and the 78.6% Fibonacci level, the downtrend wave started on May 30 from 6.913 will likely aim for the March 8 low at 6.788.
If this scenario comes into play, the simple moving average of 100 will play the key resistance to the downtrend.
Bullish Scenario
As explained earlier in this USD/DKK technical analysis, the awesome oscillator signals diverge in the 4-hour and daily charts. Hence, it is feasible for the trend to reverse or consolidate near the upper resistance levels.
That said, if the USD/DKK price breaks above the SMA 100 at the 6.87 mark, the uptick momentum formed on June 4 could initially target June’s all-time high at 6.88, backed by a 61.8% Fibonacci level. Furthermore, if the buying pressure exceeds 6.88, the next bullish target could be the May 30 high at 6.91, backed by the 50% Fibonacci level.
If this scenario unfolds, the simple moving average of 100 will support the uptrend.
USD/DKK Key Support and Resistance Level
Traders and investors should closely monitor the key levels below to make informed decisions and adjust their strategies accordingly as market conditions shift.
- Support: 6.84 / 6.788
- Resistance: 6.872 / 6.883 / 6.913
Disclaimer: This technical analysis is for informational purposes only. Past performance is not necessarily indicative of future results. Foreign exchange trading carries significant risks and may not be suitable for all investors. Always conduct your research before making any investment decisions.