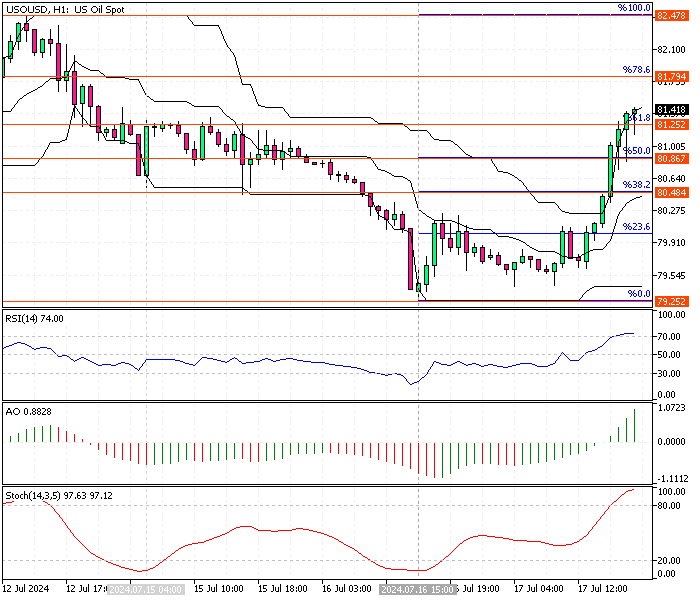
FxNews—WTI Crude Oil bounced from the July 16 low at $79.2 as the Stochastic oscillator, and RSI 14 signaled an oversold market then. As of writing, oil trades in a bull market, slightly above the 61.8% Fibonacci level at $81.2. The robust pullback from $79.2 has driven the stochastic and relative strength index indicators into overbought territory, meaning the uptrend could ease or reverse.

Crude Oil Technical Analysis – 17-July-2024
The awesome oscillator bars are green and above the signal line, signifying the bullish primary trend. However, as mentioned earlier, the momentum oscillators signal an overbought condition, likely resulting in the Oil price consolidating near the lower supply zones. It is not advisable to join a bull market when it is saturated with buying pressure.
- Also read: Crude Oil Technical Analysis – 2-August-2024
Hence, we expect the WTI Crude to dip near the %50 Fibonacci support level at 80.6. Traders and investors should monitor this level for bullish candlestick patterns, such as bullish engulfing or hammer candlestick patterns. If the price stays above the $80.6 support, the bulls will likely form a new wave and rise to the %78.6 Fibonacci support level at $81.7.
Furthermore, if the buying pressure exceeds $81.7, the next barrier will be $82.4.
WTI Crude Oil Bearish Scenario
Conversely, if the price dips below the 50% Fibonacci retracement level at $80.8, the bull market should be invalidated, and the next support level will be the 38.2 Fibonacci level at $80.4.