FxNews—Ethereum trades in a bear market but is trying to stabilize itself above the 100-period simple moving average. Despite the bullish attempt, the ETH/USD price is below the primary resistance of the August 6 high, the $2,550 mark.
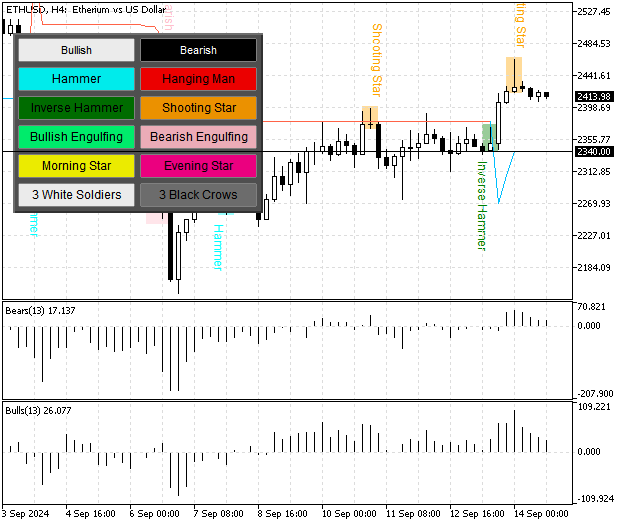
As of this writing, the ETH/USD pair trades at about $2,410, slightly above the 100-period SMA. The 4-hour chart below demonstrates the price, key support and resistance levels, and the technical indicators utilized in today’s analysis.

Ethereum Technical Analysis – 14-September-2024
The stochastic oscillator and the RSI 14 indicator are declining from the 80 and 70 levels, respectively, meaning the downtrend is strengthening. In addition to the momentum indicators, the Awesome oscillator’s recent bar turned red, meaning the uptrend that began at $2,110 is losing momentum.

As for the candlestick pattern, we notice a shooting star pattern in the 4-hour chart, suggesting the resumption of the downtrend could be imminent.
Overall, the technical indicators and the candlestick patterns suggest the uptrend is weak, and the bear market will likely prevail soon.
Ethereum Bearish Scenario
The immediate support is at the Super trend indicators, the $2,340 mark. From a technical perspective, the downtrend will likely be triggered if the ETH/USD price dips below this level. If this scenario unfolds, the next bearish target could be the August 2024 low at $2,110.
Please note that the bearish scenario should be invalidated if the price exceeds the $2,550 resistance.
Ethereum Bullish Scenario
The primary barrier for the bulls lies at $2,550 (August 06 High). The uptick momentum from $2,110 will likely extend to $2,820 (August 24 High) if the Ethereum price exceeds the primary resistance, the $2,550 mark.
Furthermore, if the buying pressure pushes the price above $2,820, the following critical resistance level will be the July 25 low at $3,085.
Ethereum Support and Resistance Levels
Traders and investors should closely monitor the key levels below to make informed decisions and adjust their strategies accordingly as market conditions shift.
- Support: $2,340 / $2,110
- Resistance: $2,550 / $2,820 / $3,085