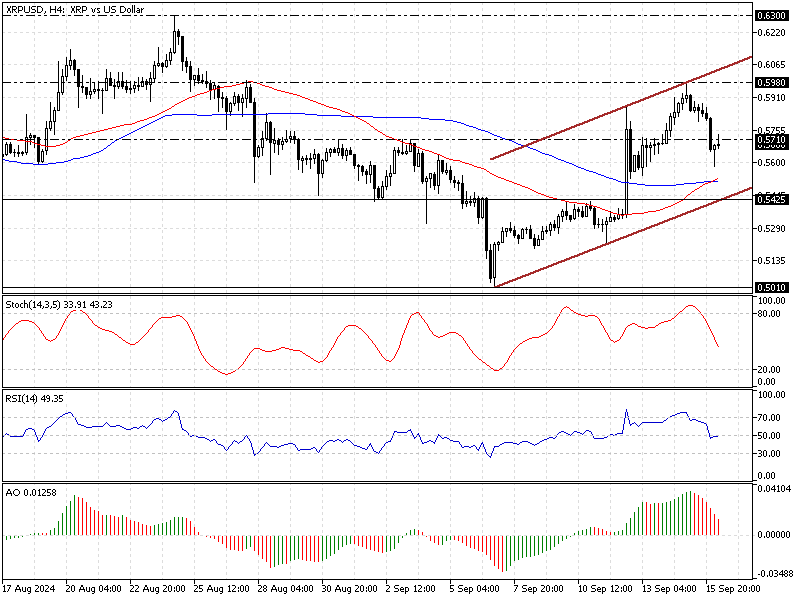
FxNews—Ripple (XRP) closed above the 100-period simple moving average on September 12 and successfully tested the August 27 high at $0.598. As of this writing, the XRP/USD pair is consolidating near the 100-SMA at approximately $0.571.
The 4-hour chart below demonstrates the price, key support and resistance levels, and the technical indicators utilized in today’s analysis.

Ripple Technical Analysis – 16-September-2024
The RSI (14) and Stochastic oscillator have exited the overbought territory, depicting 49 and 34 in value, respectively, meaning the bear market is strengthening. Additionally, the awesome oscillator histogram is red and declining, signifying the rising downtrend momentum.

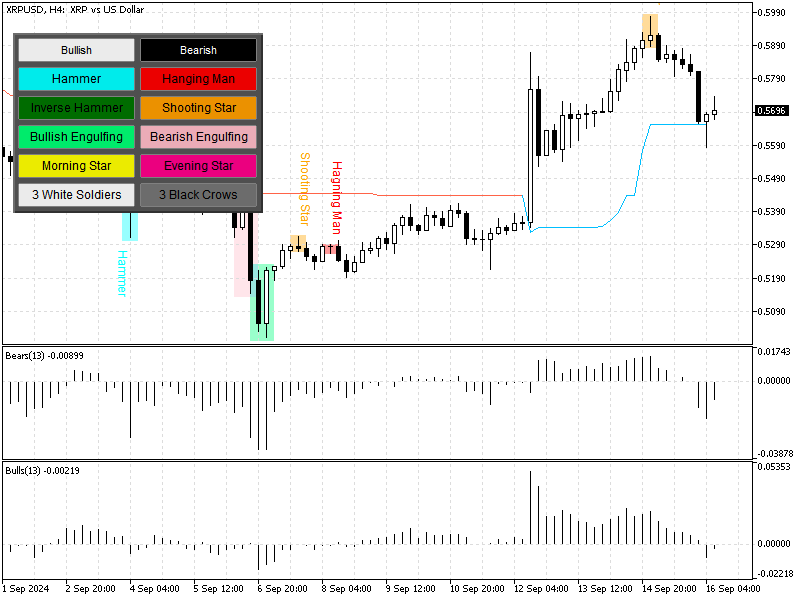
In the candlestick pattern, we notice a shooting star slightly above the 23.6% Fibonacci retracement level, which justifies the recent dip in the Ripple value.

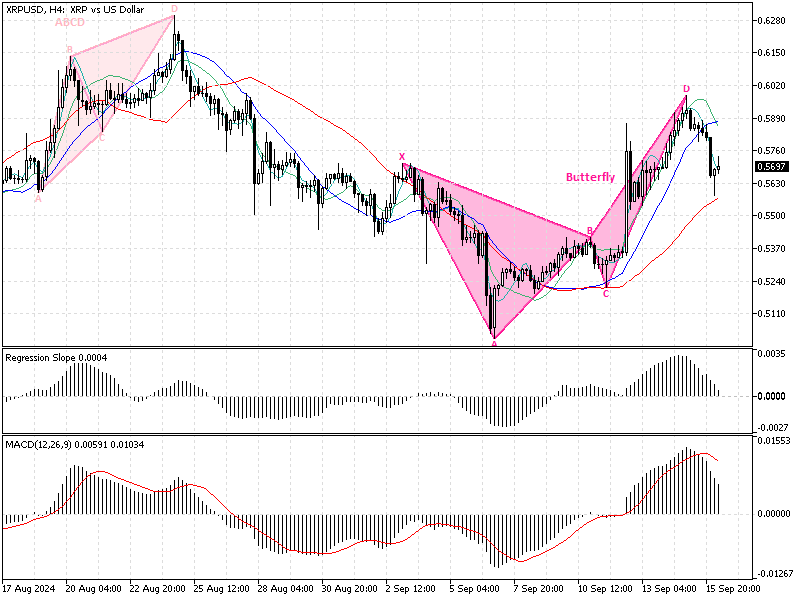
Furthermore, the 4-hour chart formed a bearish butterfly pattern, a signal for trend reversal from a bull market to a bear market.
Overall, the technical indicators suggest the primary trend is bullish, but the price has the potential to dip to lower support levels.
Ripple Price Forecast
The immediate support rests at $0.542 (September 10 High), in conjunction with the lower line of the bullish flag. From a technical perspective, the decline in the XRP/USD price will likely resume with the next target at $0.542.
Furthermore, if the selling pressure drives the price below $0.542, the bearish wave from $0.698 can potentially target the September 7 low at $0.501.
Ripple Bullish Scenario
The immediate resistance lies at $0.598, the September 14 high. The bull market will likely target $0.630 (August 24 High). Please note that the bull market should be invalidated if the XRP/USD price dips below the 100-period simple moving average, the $0.542 mark.
Ripple Key Support and Resistance Levels
Traders and investors should closely monitor the key levels below to make informed decisions and adjust their strategies accordingly as market conditions shift.
- Support: $0.542 / $0.501 / $0.46 / $0.432
- Resistance: $0.598 / $0.630