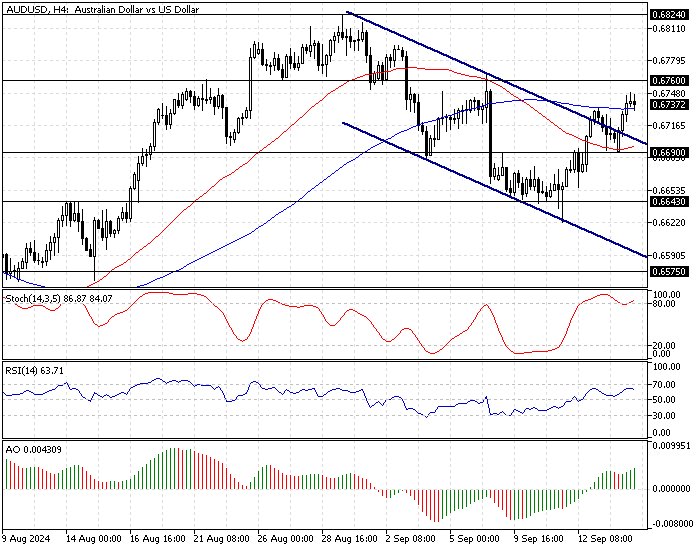
FxNews—The bull market resumed in the AUD/USD currency pair after the price broke above the descending trendline. This development in the pair’s value caused the Stochastic oscillator to become overbought. As of this writing, the Australian dollar is trading at about $0.673, slightly below its September 6 high of $0.676.
The 4-hour chart below demonstrates the AUD/USD price, support and resistance levels, and the technical indicators utilized in today’s analysis.

AUDUSD Technical Analysis – 16-September-2024
The Awesome oscillator histogram is green and above the signal line, meaning the primary trend is bullish. Additionally, the price is above the 50- and 100-period simple moving averages, signifying the bullish primary trend.
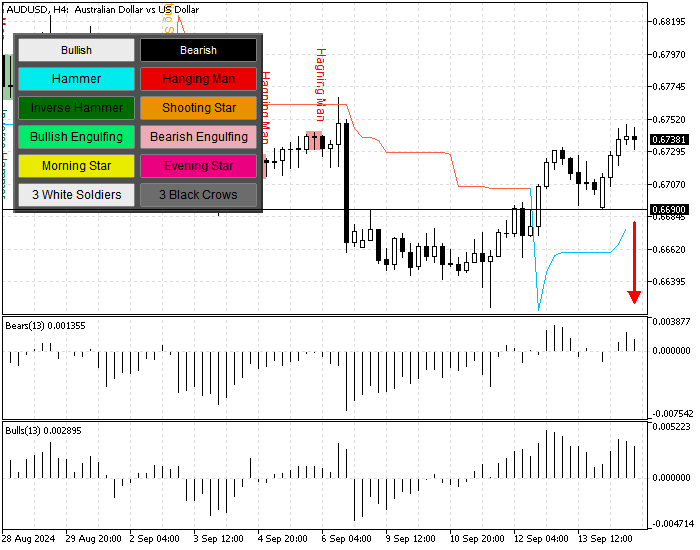
Overall, technical indicators suggest the primary trend is bullish, but the AUD/USD price might consolidate near the immediate support before the uptrend resumes.
AUDUSD Price Forecast

The primary barrier rests at $0.676, the September 6 high. The bull market will likely target $0.682 (August 2024 High) if the buyers close and stabilize the price above $0.676. Furthermore, if the buying pressure exceeds $0.682, the next resistance area will be the December 2023 high at $0.687.
Please note that the bullish scenario should be invalidated if the AUD/USD price falls below $0.669, the September 13 low.
AUD/USD Bearish Scenario

The September 13 low at $0.669 is the immediate support. A new bearish wave will be triggered if the Australian dollar’s value falls below $0.669. In this scenario, the next support area will be $0.664 (September 10 Low), followed by $0.657 (August 15 Low).
AUD/USD Support and Resistance Levels
Traders and investors should closely monitor the key levels below to make informed decisions and adjust their strategies accordingly as market conditions shift.
- Support: $0.664 / $0.657 / $0.651
- Resistance: $0.676 / $0.682 / $0.687