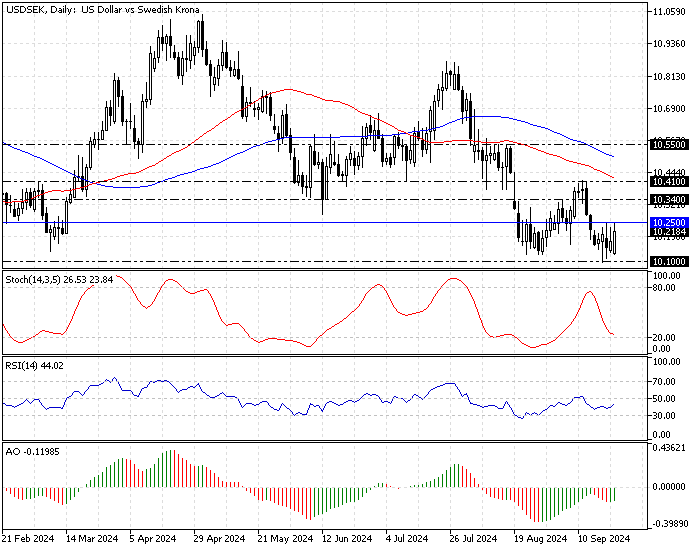
FxNews—The U.S. dollar bounced from 10.1 resistance, which coincides with the August 28 low against the Swedish Krona. The USD/SEK currency pair tested the 10.23 resistance today, and as a result, the price is pulling back from the 100-period simple moving average.
The daily chart below demonstrates the price, support, resistance levels, and technical indicators used in today’s analysis.

USDSEK Technical Analysis – 23-September-2024

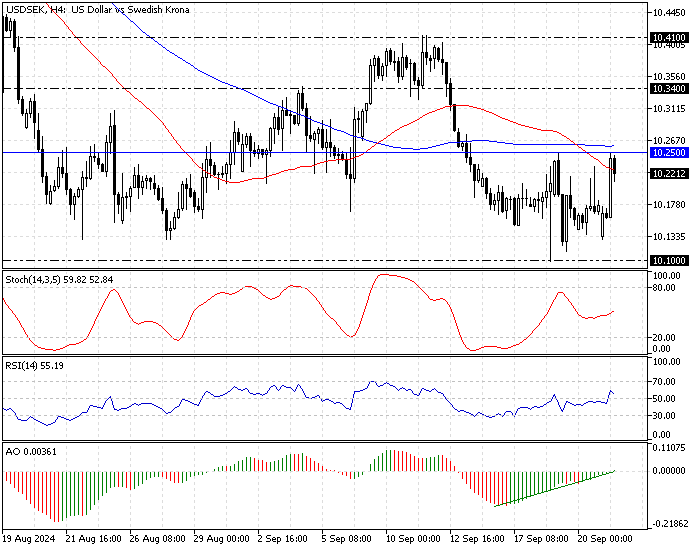
The bullish momentum in the USD/SEK pair was anticipated because the Awesome oscillator signaled divergence this month, and the indicator’s histogram flipped above the signal line from below.

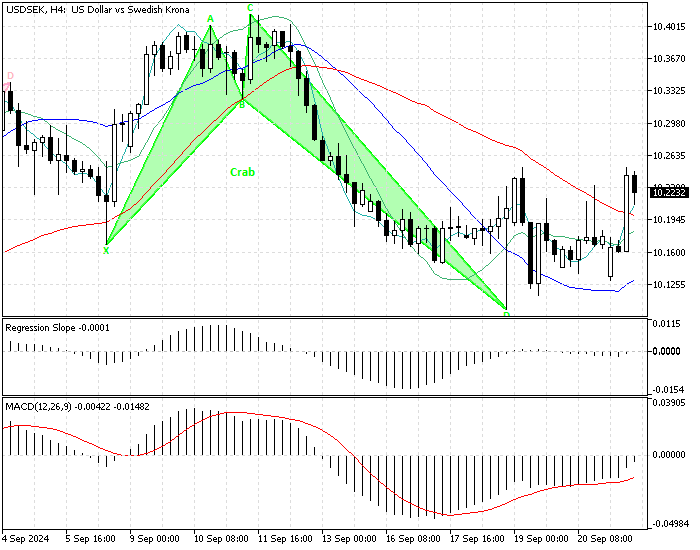
Additionally, the 4-hour chart formed a bullish crab pattern, signaling an uptrend could be on the horizon.
Overall, the technical indicators and the harmonic pattern suggest the primary trend is bearish, but there is a probability for the USD/SEK trend to reverse from bearish to bullish.
USDSEK Forecast – 23-September-2024
The immediate resistance rests at 10.25, the 100-period simple moving average. From a technical perspective, the consolidation phase from 10.1 could aim for 10.34 if the bulls cross and stabilize the price above 10.25.
If this scenario unfolds, the 50-period moving average will primarily support the uptrend. Furthermore, if the buying pressure exceeds 10.25, the next bullish barrier will be 10.34, the September 4 high.
USDSEK Bearish Scenario – 23-September-2024

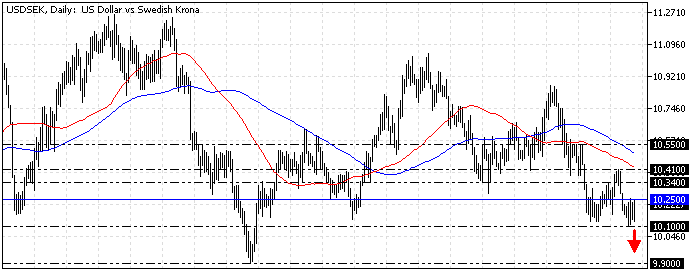
Conversely, if the bears (sellers) close and stabilize the price below the psychological resistance level at 10.1, the downtrend will likely be triggered. In this scenario, the USD/SEK price decline could extend to 9.90.
Please note that the 100-period simple moving average is the primary resistance to the bearish scenario. The selling strategy should be invalidated if the USD/SEK price exceeds 10.25.
USDSEK Support and Resistance Levels – 23-September-2024
Traders and investors should closely monitor the key levels below to make informed decisions and adjust their strategies accordingly as market conditions shift.
- Support: 10.1 / 9.9
- Resistance: 10.25 / 10.34 / 10.41 / 10.55a