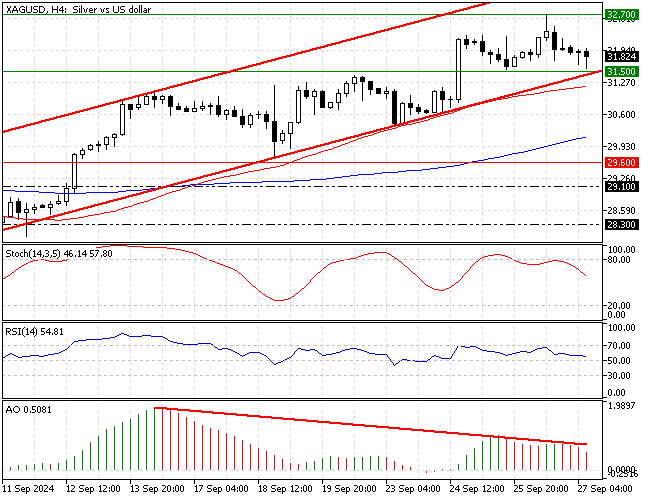
FxNews—Silver is in a bull market, above the 50- and 100-period simple moving averages. As of writing, the XAG/USD pair is testing the $31.5 immediate support, coinciding with the ascending trendline in the 4-hour chart (image below).

Silver Technical Analysis – 27-September-2024

The Awesome oscillator signals divergence and the bars are red and declining. This means the bear market is strengthening. Hence, the Silver price has the potential to consolidate.

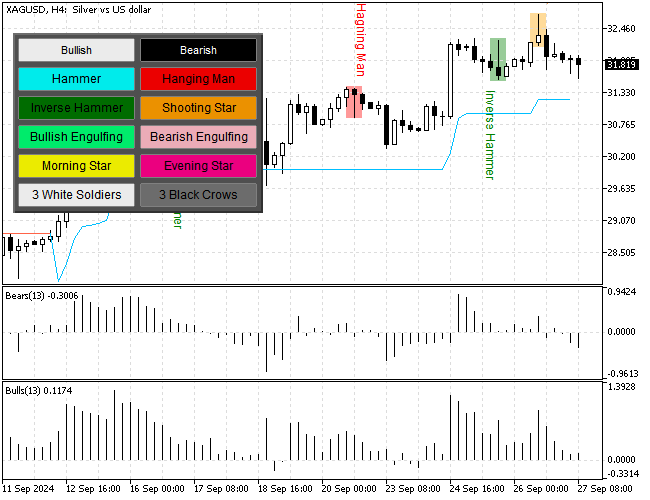
Furthermore, the 4-hour chart formed a ‘shooting star’ candlestick pattern, signaling the current bearish wave should resume.
Overall, the technical indicators and the candlestick pattern suggest a bullish primary trend, but the Silver price might dip and test the lower support levels.
Silver Price Forecast: Bearish Scenario

The immediate resistance rests at the September 25 low, the $31.5 mark. If the bears (sellers) close and stabilize the price below $31.5 or the ascending trendline, the current downtick momentum has the potential to extend to the next support area, the August 26 high at $30.2.
The $30.2 is a critical and robust supply level backed by the 100-period simple moving average. Hence, traders and investors should monitor this level closely for a bullish signal to join the bull market.
Silver Bullish Scenario
If bulls (buyers) hold the Silver price above the immediate support at $31.5, the uptrend will likely resume.
In this scenario, the buyer’s initial target would be the September 26 high at $32.7. Furthermore, if the buying pressure pushes the price above $32.7, the next resistance area will be the $34.0 mark.
Silver Support and Resistance levels
Traders and investors should closely monitor the key levels below to make informed decisions and adjust their strategies accordingly as market conditions shift.
- Support: $31.5 / $30.2 / $29.6
- Resistance: $32.7 / $34.0