In August 2024, Norway’s manufacturing production decreased 1.1% from the previous month. This marked an end to the country’s three consecutive months of growth, which had seen a notable increase of 2.1% in July.
The USD/NOK daily chart below demonstrates that American currency trades are bullish against the Norwegian Krone.

Significant Sector Setbacks
The production of basic chemicals saw a sharp fall of 5.5%, a significant shift from the modest growth of 0.3% observed in July. Similarly, the fabrication of metal products dropped by 1.5%, reversing the previous month’s gain of 2.1%.
The sectors producing ships, boats, and oil platforms also struggled, with production decreasing by 3.7% following a 6.3% rise in July. Additionally, the repair and installation of machinery and furniture manufacturing sectors faced downturns, with declines of 3.8% and 3.9%, respectively.
Continued Challenges in Other Areas
Further challenges were evident in producing paper and paper products, non-ferrous metals, and basic metals, which continued to show a downward trend.
Paper production modestly decreased by 1%, an improvement over July’s 4.8% decrease; non-ferrous metals production fell by 1.1%, and basic metals slightly reduced by 0.1%.
Annual Overview
Despite the monthly decline, the annual outlook provides a silver lining. On a year-over-year basis, manufacturing production rose by 3.2%, decelerating from the 6.6% growth the previous year. This suggests a slowing yet positive growth trajectory in Norway’s manufacturing sector.
While Norway’s manufacturing sector faced setbacks in August, the overall yearly growth indicates resilience amid fluctuating market conditions.
- Also read: Yuan Drops as China Delays Stimulus Boost
USDNOK Technical Analysis – 8-October-2024

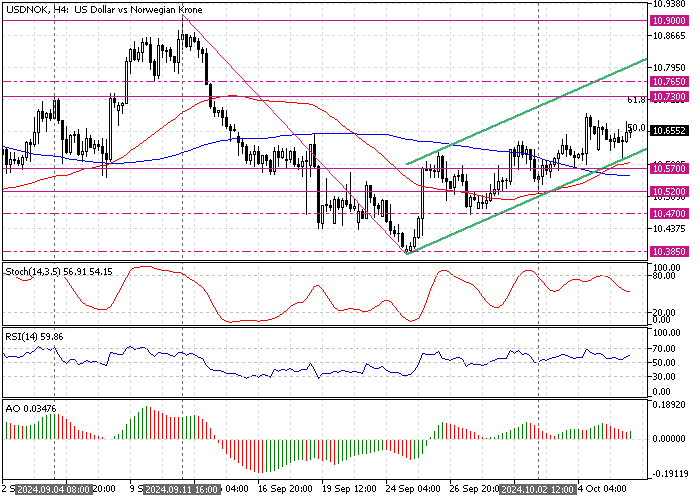
FxNews—The USD/NOK currency pair trades above the 50- and 100-period simple moving average at approximately 10.65 in today’s trading session. The primary trend should be considered bullish as the price is above the moving averages and the ascending trendline, as the 4-hour chart above shows.
Additionally, the Awesome oscillator histogram is above the signal line, and the recent bar turned green, signaling that the bull market is strengthening.
Overall, the technical indicators suggest the primary trend is bullish, and the USD/NOK price should rise to upper resistance levels.
USDNOK Forecast – 8-October-2024

The immediate support is at 10.57, backed by the 50-period simple moving average and the ascending trendline. From a technical perspective, if the 10.57 support holds, the current uptick momentum will likely target 10.73, the September 4 high.
Furthermore, if the buying pressure exceeds 10.73, the next bullish target could be the September all-time high at 10.9.
USDNOK Bearish Scenario – 8-October-2024

A new bearish wave will likely be generated if bears (sellers) close and stabilize the USD/NOK conversion rate below the immediate support of 10.57. In this scenario, the following bearish target could be the 10.52 mark (October 2 Low), followed by the September 27 low at 10.47.
USDNOK Support and Resistance Levels – 8-October-2024
Traders and investors should closely monitor the key levels below to make informed decisions and adjust their strategies accordingly as market conditions shift.
- Support: 10.57 / 10.52 / 10.47 / 10.38
- Resistance: 10.37 / 10.76 / 10.9