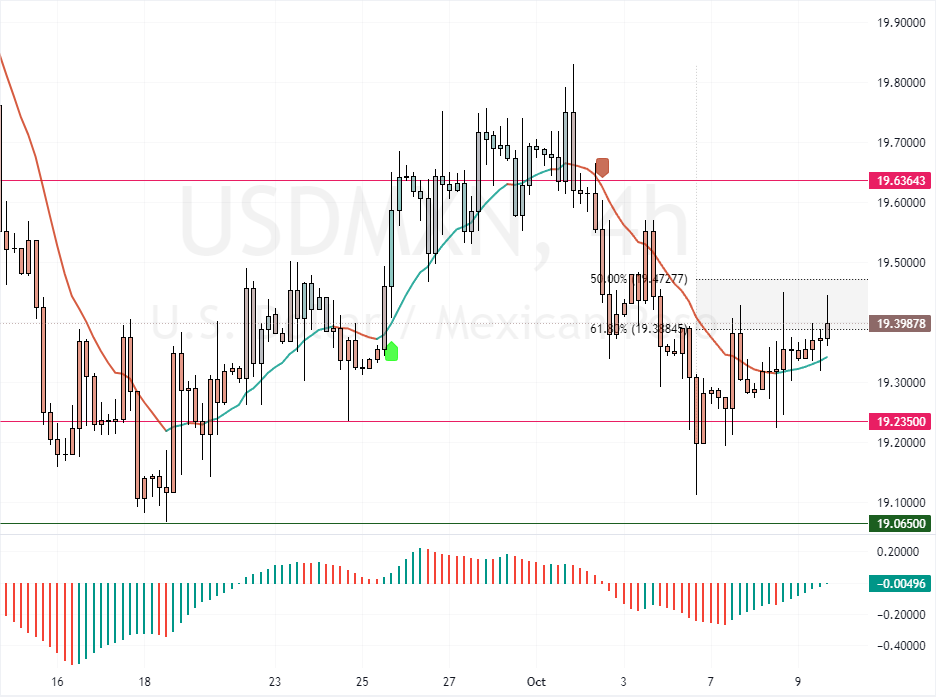
Fxnews—The Mexican peso has weakened, trading above 19.4 against the US dollar. This marks a shift from its stronger position at 19.27 per USD on October 4. This change comes as investors review the latest updates on Mexico’s inflation rates while the US dollar strengthens.
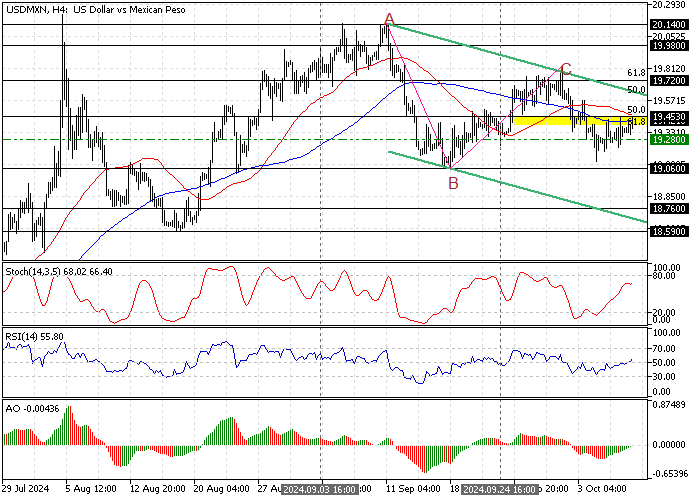
The 4-hour chart below shows the USD/MXN price, as well as the key Fibonacci levels.

Inflation Trends in Mexico
In September, Mexico reported a decrease in its core annual inflation rate to 3.91%, the lowest since February 2021. This drop from 4% in August was slightly better than experts predicted.
The primary inflation rate also fell for the second month in a row to 4.58%, the lowest it has been since March and under the expected 4.62%.
Potential Rate Cuts
The easing of inflation pressures might lead the Bank of Mexico to reconsider reducing interest rates again. They recently lowered rates, and further cuts could make the peso less attractive.
At the same time, the US dollar has been getting stronger. This strength is due to the belief that the US Federal Reserve might not be as generous with its monetary policy. Additionally, more people are buying the dollar because they see it as a safer option during uncertain times, which adds to the pressure on the peso.
USDMXN Technical Analysis – 9-October-2024

The USD/MXN trades at about 19.41, testing the BC bullish wave’s 50% Fibonacci retracement level. This resistance area is backed by the 50- and 100-period simple moving averages, making it a robust barrier for the bulls.
USDMXN Forecast – 9-October-2024

From a technical standpoint, the uptrend from 10.06 will likely resume if the USD/MXN price flips above the 50% Fibonacci at 19.453. If this scenario unfolds, the bull’s path to the September 27 high at 19.72 will likely be paved.
Furthermore, if the buying pressure exceeds 19.72, the next bullish target could be the 19.98 area, the September 3 high.
USDMXN Bearish Scenario – 9-October-2024

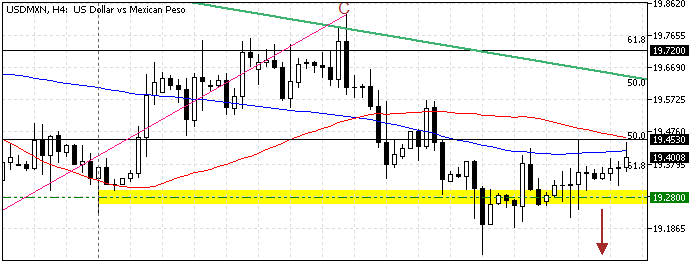
The immediate support lies at 19.28, the September 24 low. If sellers push the USD/MXN price below this support, a new bearish wave can potentially emerge. In this scenario, the bearish wave could spread to the September 2024 low at 19.06.
USDMXN Support and Resistance Levels – 9-October-2024
Traders and investors should closely monitor the key levels below to make informed decisions and adjust their strategies accordingly as market conditions shift.
- Support:19.28 / 19.06
- Resistance: 19.45 / 19.72 / 19.98