In this SOLUSD Analysis, we delve into the latest cryptocurrency market developments and examine the influence of technical indicators on the SOLUSD price trajectory.
SOLUSD Analysis-The Impact of ETF Rumors
Reuters—During a recent market rollercoaster caused by rumors about an ETF, Bitcoin’s availability on Binance dropped significantly. Kaiko, a company based in Paris, tracked this. Because of this, many traders faced ‘slippage,’ which meant they couldn’t buy or sell Bitcoin as quickly as they wanted to.
Binance is usually the biggest exchange for cryptocurrencies, but on that day, traders on Kraken and Coinbase had an easier time. This happened because the number of buy orders on Binance fell from 100 BTC to just 1.2 BTC ($30,000). This was due to a false report about BlackRock’s ETF getting approved.
‘0.1% ask depth’ describes the number of buy orders within 0.1% of the average price. The higher this number, the easier for people to buy and sell large amounts without affecting the price too much.
High Slippage Causes Losses on OKX and Bybit
On that day, the ask depth also fell on OKX and Bybit, and the average across all major exchanges was less than 95 BTC. Because of this, some traders, including Exitpump and Omz, lost money due to slippage. In some cases, the slippage was as high as 20%.
According to Carey, Kraken and Coinbase performed better than Binance and other exchanges because their market makers—people who create buy and sell orders—are more sophisticated.
Solana Technical Analysis: The Technical Factors
The recent SOLUSD analysis observed a noteworthy event in the cryptocurrency market. Solana represented as SOLUSD, saw a remarkable surge in its price, peaking at $27. This uptick was primarily driven by rumors of an Exchange-Traded Fund (ETF) approval, a trend also reflected across other cryptocurrencies.
SOLUSD 4H Chart

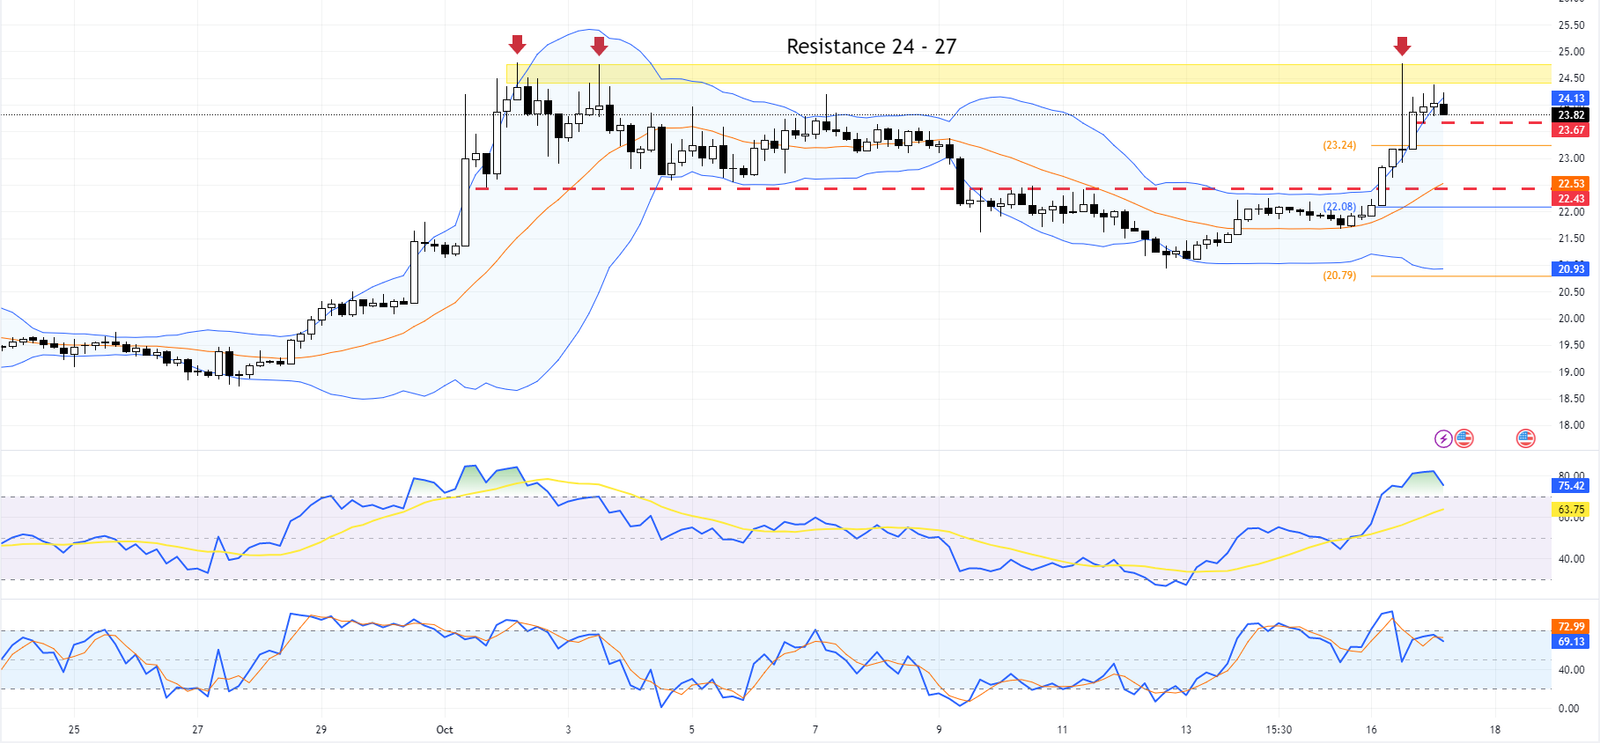
The SOLUSD analysis indicates that this surge led the price to hit the resistance zone between $24 and $27. Consequently, technical indicators such as the Relative Strength Index (RSI) and the Stochastic Oscillator entered the overbought territory. Often used in SOLUSD analysis, these indicators suggest a potential market correction.
Further SOLUSD analysis shows that as the price broke through the upper band of the Bollinger Bands, Solana is likely to correct its recent gains and potentially decline to $22.4, which aligns with the middle band of the Bollinger Bands.
SOLUSD H1 Chart

However, this SOLUSD analysis scenario will only materialize if SOLUSD closes below the middle line of the Bollinger Bands on the 1-hour chart, currently around $23.5. If bearish momentum is observed, the SOLUSD analysis predicts a continuation of this trend.
In this bearish scenario predicted by our SOLUSD analysis, the first target would be $23.24, followed by a further decline to the crucial $22 mark. Traders must monitor these key levels and indicators in their own SOLUSD analysis to make informed decisions in this volatile market.