FxNews—To forecast the Forex market efficiently, traders must familiarize themselves with the Harmonic Patterns, a strategy based on the specific geometric structure of price action and Fibonacci numbers. The reason for utilizing harmonic patterns in technical analysis is to spot possible reversal points in the market.
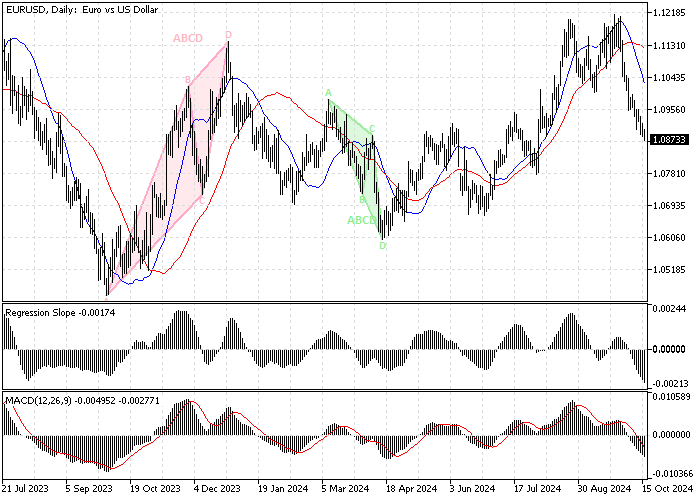
The EUR/USD daily chart below shows two ABCD bearish harmonic patterns. As demonstrated, the EUR/USD trend reversed after the pattern was shaped.
5 Key Aspects of Harmonic Patterns
Geometric Shape: Harmonic patterns are created from geometric shapes such as triangles and rectangles. These geometric shapes can be traced by observing swing highs and lows on a price chart.
Fibonacci ratios: The harmonic patterns rely heavily on Fibonacci retracement levels of 38.2%, 61.8%, and 161.8%. These levels are calculated according to the length of previous bullish or bearish waves to predict the next price wave.
Popular Harmonic Patterns: The most common and popular harmonic patterns are the Gartley, Bat, Butterfly, and Crab patterns. Each pattern takes a unique approach to the price action.
Trading Signals: When one of the aforementioned harmonic patterns is found on the price chart, traders and investors closely monitor the market to find decent entry and exit points. However, using the patterns solely is not advisable, and traders should mix this strategy with other indicators for confirmation.
Reversal Point: The main reason for utilizing Harmonic Patterns is to trade on market reversal points and “potential reversal zones” or “PRZ” with a higher level of accuracy than the lagging indicators that any trading platform usually offers for free.
Download the Best Harmonic Pattern Indicator for MT5
The Harmonic pattern requires complex calculations, but fortunately, several tools are available on the MetaTrader 5 platform that calculates and draws Harmonic Patterns on the price chart. This article aims to make trading easy and convenient for our readers and audiences.
This outlook led us to find the best Harmonic Pattern indicator for you: the ‘Basic Harmonic Pattern MT5’ Mr. Mehran Sepah Mansoor designed. You can also download the indicator for free from the MQL5 website or click the link below to download it from Google Drive.
How to Use the Harmonic Pattern
The process is straightforward. After downloading and installing the indicators, drag and drop the indicator into the price chart, and the Harmonic patterns automatically show on the chart.
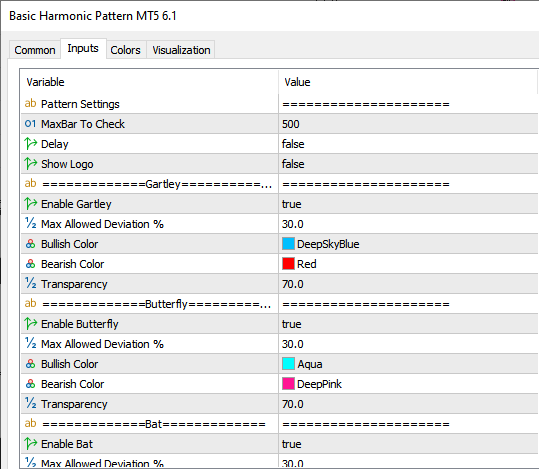
The indicator has a pop-up alert feature that notifies you when a new pattern forms on the price chart. It also highlights stop losses and takes profit points for more convenient trading. From the settings, you can also turn off the developer’s logo.
How to Use Harmonic Pattern Indicator
The EUR/USD 4-hour chart below is a good example of how to use Harmonic Patterns. The first pattern, highlighted in green, is an ABCD pattern.
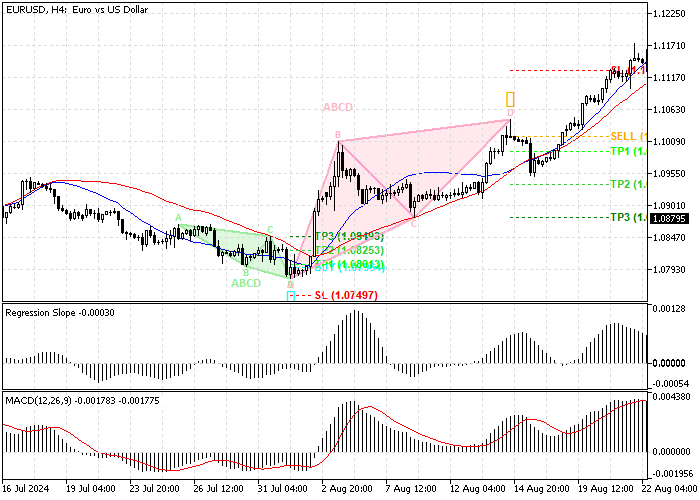
As depicted on the price chart, the indicator automatically highlighted the stop-loss level at 1.079 and the take profits in green. I have added the blue 50-period regression line to confirm the buy signal.
When the bullish ABCD pattern is formed, wait for the price to close above the 25- or 50-period regression line and then enter a buy trade. The risk for this order is automatically shown by the Harmonic Pattern Indicator, below the recent lows at 1.074 in this example.
Example 2: This example will shed more light on how to use Harmonic Patterns in technical analysis. The chart below represents GBP/USD; the time frame is 4 hours.
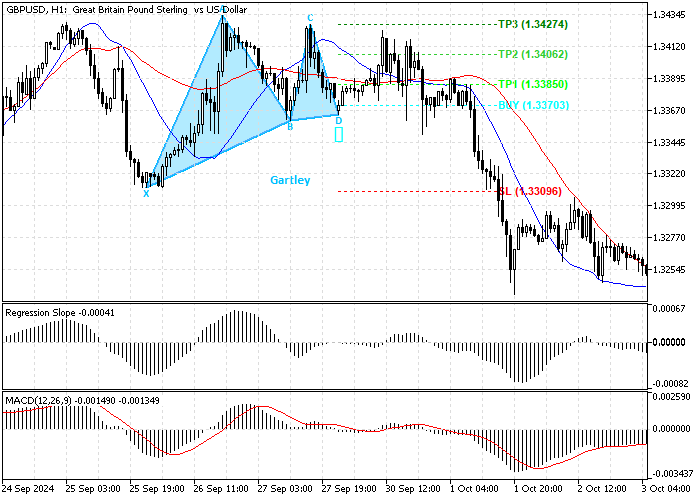
The Harmonic Pattern MT5 indicators found a Gartley pattern on the price chart, with a stop-loss below point X at 1.330 and targets set at 1.338 and 1.340, followed by the 1.340 mark.
The indicator also gives users an entry point, but we suggest utilizing the 25-period regression line for confirmation. After the price close above the regression line, the GBP/USD uptick momentum resumed and hit the second target at 1.340.
Key Tips for Using the Harmonic Pattern Indicator
The trick for using this indicator is to bring the stop loss level forward to the entry point when the price reaches the first target. This method ensures the risk remains at its minimum, and if the trade is profitable, the profit will also be secured.
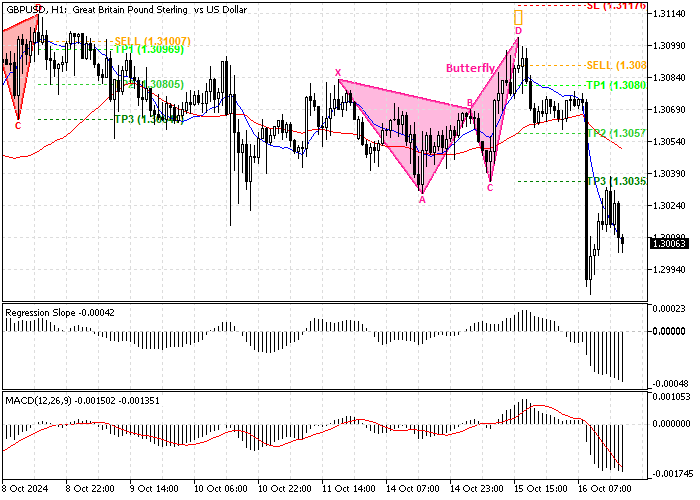
The GBP/USD chart below also demonstrated a butterfly pattern with stop loss and take profits highlighted on the chart, a successful signal that ended in profit.
Best Time Frame for Harmonic Patterns
We have been monitoring and utilizing the Harmonic Pattern MT5 indicator for a long time and concluded that higher time frames, such as 4 hours, are the best match for this amazing tool.
The Harmonic Pattern MetaTrader 5 indicator has more errors in the lower time frames, such as 1 hour or less. Therefore, we do not advise our readers to use this indicator in any time frame except the 4-hour.
We hope this article helps you make informed decisions in your daily trading activities.