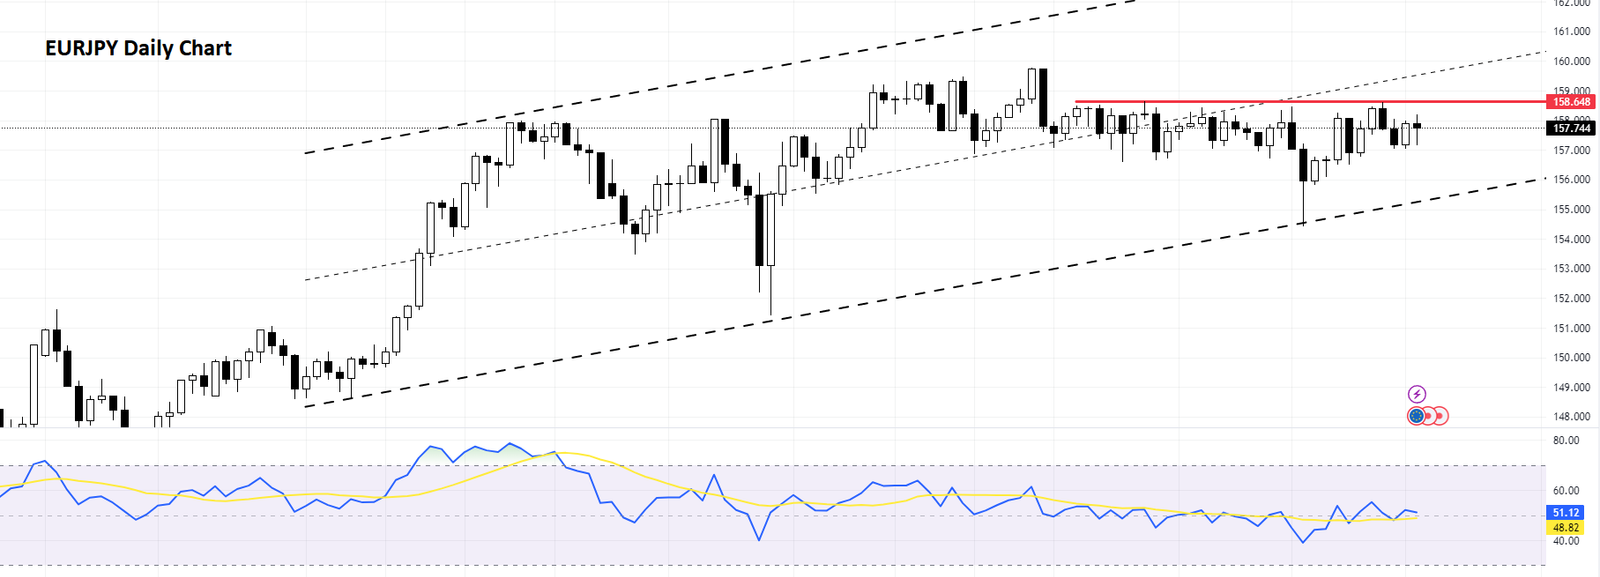
In today’s comprehensive EURJPY forecast, we will first examine Japan’s current economic conditions. Then, we will meticulously examine the EURJPY pair’s technical analysis. Stay tuned for insightful observations and key takeaways.
Japan’s Nikkei 225: Wall Street Optimism Breaks Slump
Bloomberg—On Tuesday, Japan’s Nikkei 225 Index increased significantly by 1.2%, closing at 32,040. Similarly, the more comprehensive Topix Index rose by 0.82% to reach 2,292. This positive shift broke a two-day slump and was influenced by the robust performance on Wall Street the previous night. The optimism surrounding corporate earnings seemed to overshadow the increase in Treasury yields.
Investors eagerly await Japan’s September inflation report, due later this week. This report is particularly significant as it precedes the central bank’s monetary policy meeting scheduled for October 30 and 31.

In this upward trend, technology stocks were at the forefront. Notable gains were seen from Tokyo Electron (2.4%), SoftBank Group (2.7%), Keyence (1.6%), Advantest (1.2%), and Disco Corp (2.3%).
Other major players in the index also saw advancements, including Toyota Motor (0.8%), Fast Retailing (0.8%), and Sony Group (1.6%).
EURJPY Market Analysis-Bulls Hit Hurdle
In our comprehensive EURJPY market analysis, we’ve noticed a significant trend. The EURJPY pair is trading within a bullish channel, indicating a potential upward momentum in the market.
The Relative Strength Index (RSI), a key technical indicator above 50, further supports this. The RSI’s position suggests that the market’s strength favors the bulls when writing this EURJPY market analysis.

On October 3, an important event occurred. The EURJPY pair could not close below the Ichimoku cloud, a renowned technical analysis tool used to identify trend direction, support, and resistance levels and generate buy-sell signals. This inability to close below the Ichimoku cloud resulted in the continuation of the EURJPY uptrend, demonstrating the bulls’ resilience in this market.

However, every market has its challenges. The EURJPY bulls’ main resistance lies at the 158.64 mark. This level represents a significant barrier that needs to be overcome for the bullish bias to continue.
The future of this currency pair hinges on whether the EURJPY bulls can close above this 158.64 resistance level. Achieving this feat would signal a strong bullish sentiment in the market and potentially pave the way for further upward movement.
- Also read EURJPY Analysis – Potential Breakout.
If the bulls triumph over the 158.64 resistance level, our next anticipated target for this currency pair would be around the 162.0 area. This would mark a significant milestone for the EURJPY pair and could open up new trading opportunities for investors and traders alike.
In conclusion, while the current market conditions seem favorable for the bulls, monitoring key technical levels and indicators is crucial. Multiple factors should be considered when conducting market analysis and making trading decisions.