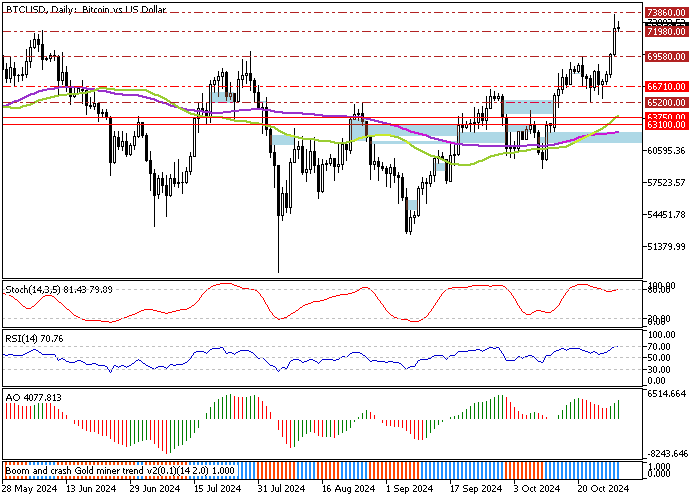
FxNews—Bitcoin‘s bullish momentum eased when the price hit a March 2024 high, the $73,860 mark. As of this writing, the digital gold pulled back, testing the May 21 high at $71,980 as resistance.
The BTC/USD daily price chart below demonstrates the price, support, resistance levels, and technical indicators utilized in today’s analysis.

Bitcoin Technical Analysis – 30-October-2024
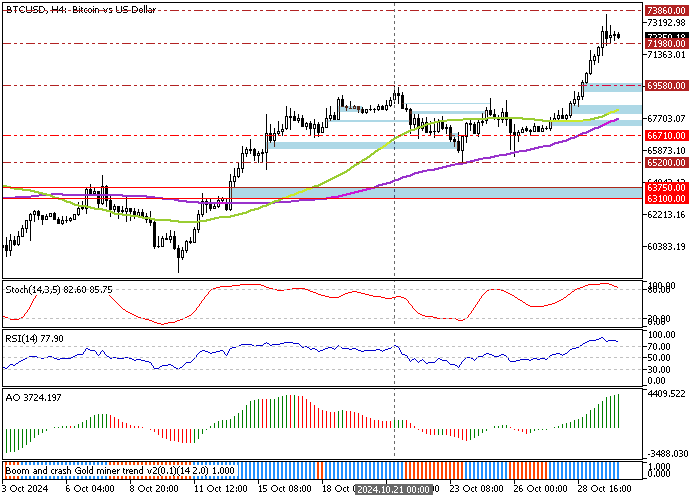
Zooming into the 4-hour chart, we notice the Stochastic oscillator and RSI 14 hover in overbought territory, recording 85 and 79 in the description, respectively. This means Bitcoin is overpriced in the short term and might consolidate near the lower support level.

The immediate support is at $71,980. If bears push the price below the support, the downtick momentum could extend to $69,580, the October 21 high. This level delivers retail traders and investors a proper bid to join the bull market. Hence, the $69,580 critical support should be monitored closely for bullish candlestick patterns.
Bitcoin Overvalued Wait for Safer Entry at $69,580
Please note that the momentum indicators warn about the overpriced Bitcoin in the daily and the 4-hour price chart. Therefore, it is not advisable to join the uptrend while the trading instrument is valued more than its actual worth.
That said, we suggest waiting patiently for Bitcoin to consolidate near $69,580, a supply zone that offers a low-risk entry point to Bitcoin fans.