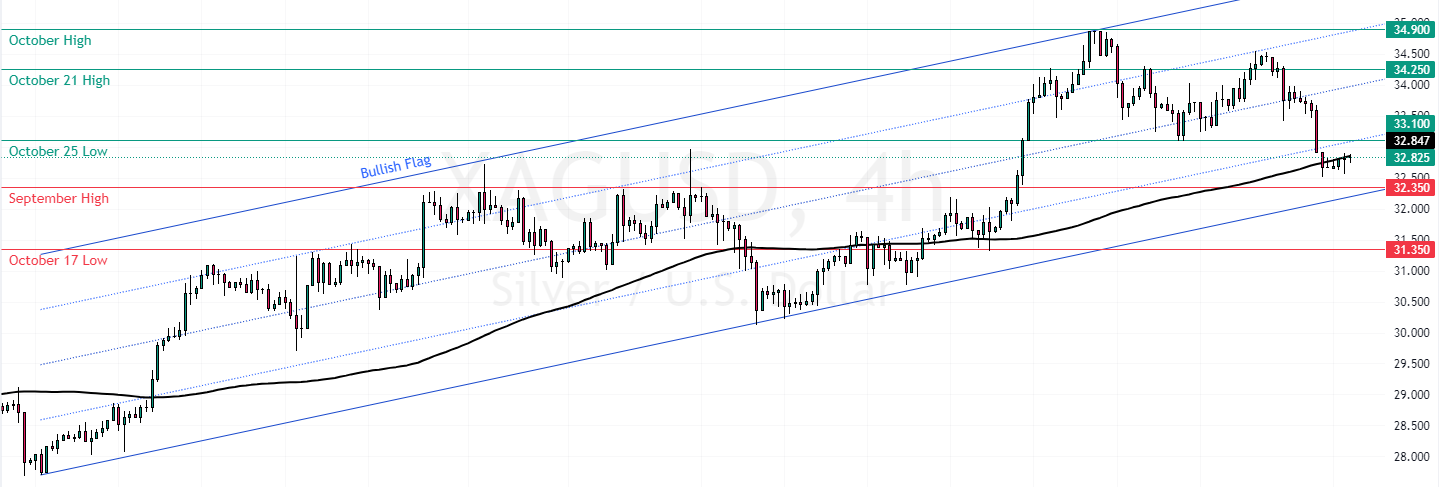
FxNews—Silver‘s downtrend from $34.9 eased when the price hit the 100-period simple moving average at $32.83 as support. This level is backed by the lower line of the bullish flag, as demonstrated in the 4-hour chart below.

Silver Technical Analysis – 1-November-2024

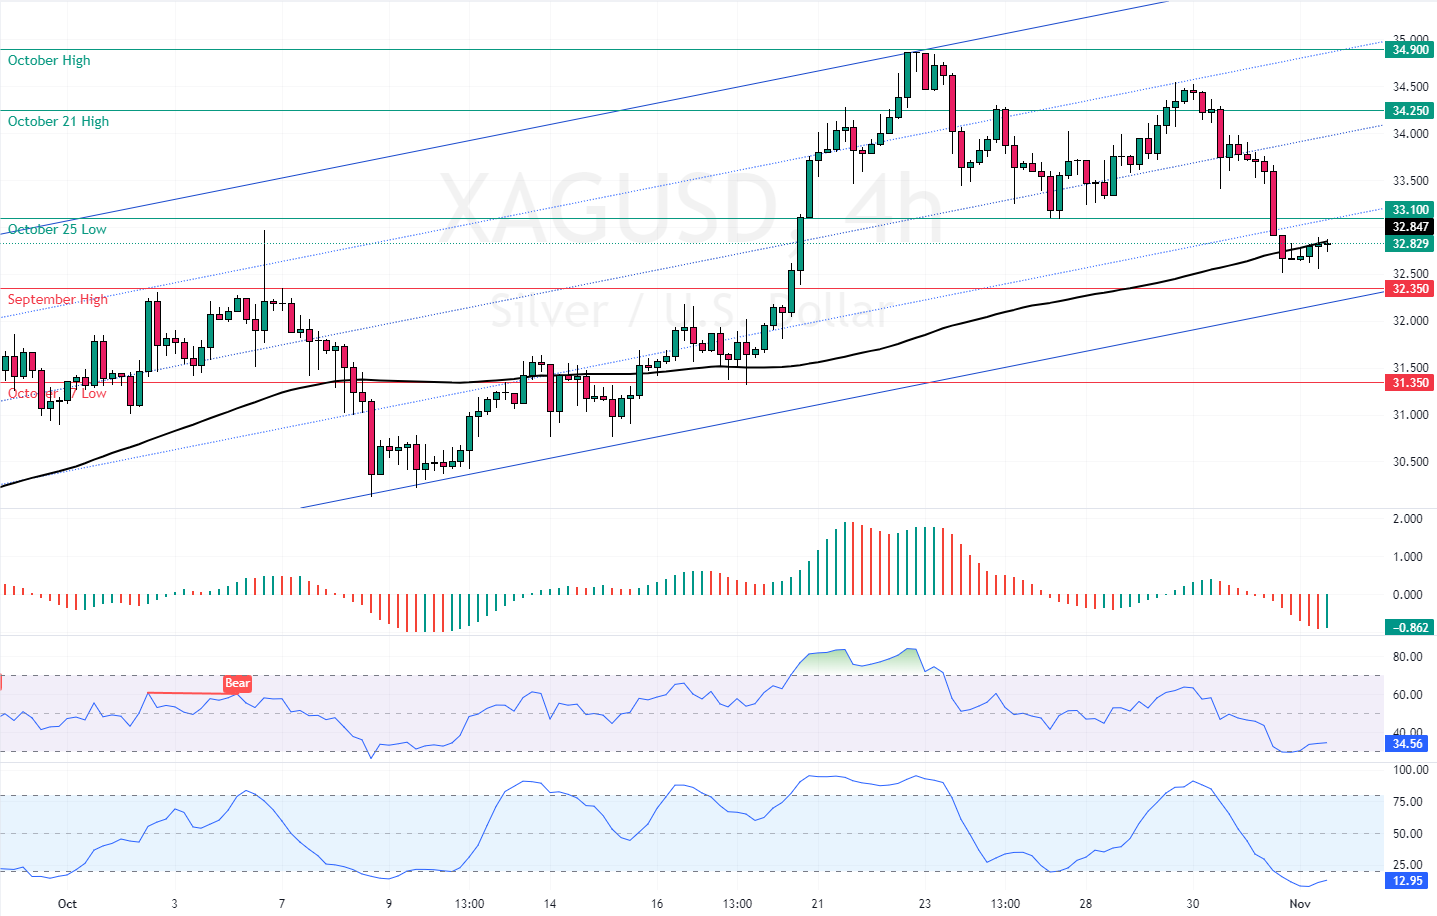
As of this writing, XAG/USD trades at approximately $32.83, while the Stochastic Oscillator records show the market is oversold. Furthermore, the Awesome Oscillator’s recent histogram turned green, meaning the bear market lost momentum.
Overall, the technical indicators suggest that while the primary trend is Silver, Silver is oversold and has the potential to rise toward upper resistance levels.
Watch Silver as It Approaches Crucial $33.1 Resistance

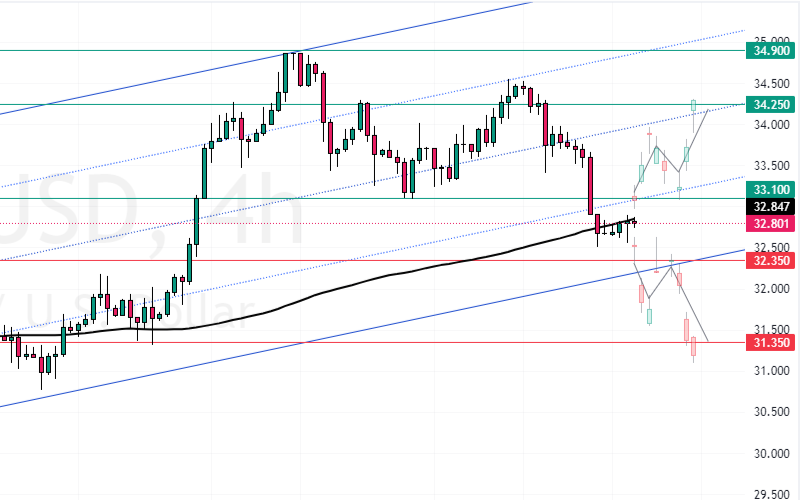
The immediate resistance is at the October 25 low, the $33.1 mark. From a technical perspective, the uptrend will likely be triggered if bulls close and Silver’s price is above $33.1, which is an immediate resistance.
If this scenario unfolds, the next bullish target could be the October 21 high at $34.25. Please note that the bullish trend should be invalidated if XAG/USD falls below the $32.35 immediate support, the September all-time high price.
Bearish Scenario
If bears (sellers) close XAG/USD below $32.35, the downtrend could extend to the October 17 low at $31.35.
Key Support and Resistance Levels
Traders and investors should closely monitor the key levels below to make informed decisions and adjust their strategies accordingly as market conditions shift.
- Support: 31.35 / 31.35
- Resistance: 33.1 / 31.24 / 34.9