FxNews—The Australian dollar traded at about 0.664 against the U.S. Dollar in today’s trading session. The currency pair has been on an uptrend since April 19, reaching the 0.636 mark today.
AUDUSD Bullish Trend Faces Resistance at $0.664

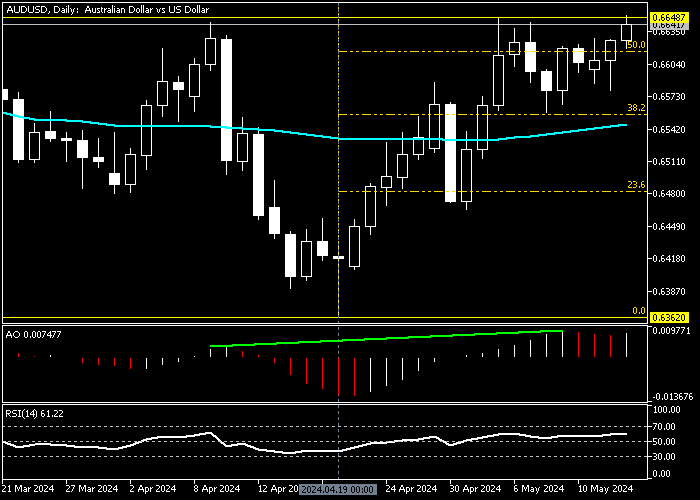
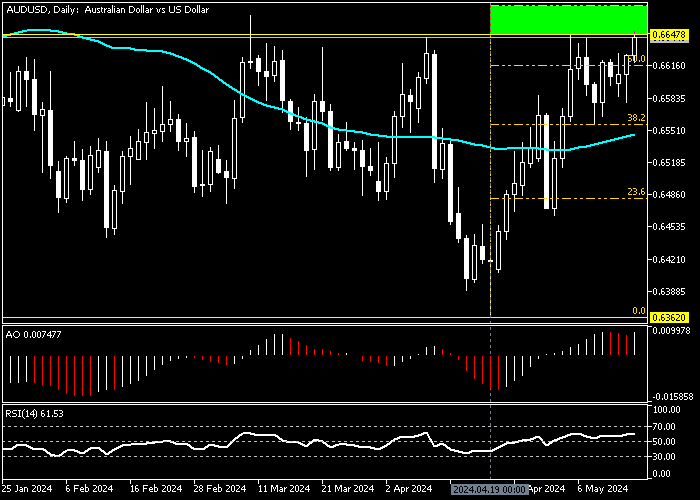
As of this writing, the AUDUSD bulls are testing the 0.6648 robust resistance mark, a barrier that caused the price to bounce three times this year.
Interestingly, the awesome oscillator indicator signals divergence, which interprets as the bullish wave might cool down. On the other hand, the RSI is bullish in the daily chart, showing a value of 61.0.
According to the AUDUSD daily chart, the trend is bullish but encounters strong resistance that might pause the current momentum, or the market might even reverse from 0.664. This scenario should be taken seriously because a divergence signal usually leads to either the market entering a correction phase or reversing the trend.
Hence, to find critical levels and dissect the price action closely, we zoomed in on the 4-hour chart.
Trend Reversal Likely as Indicators Signal divergence

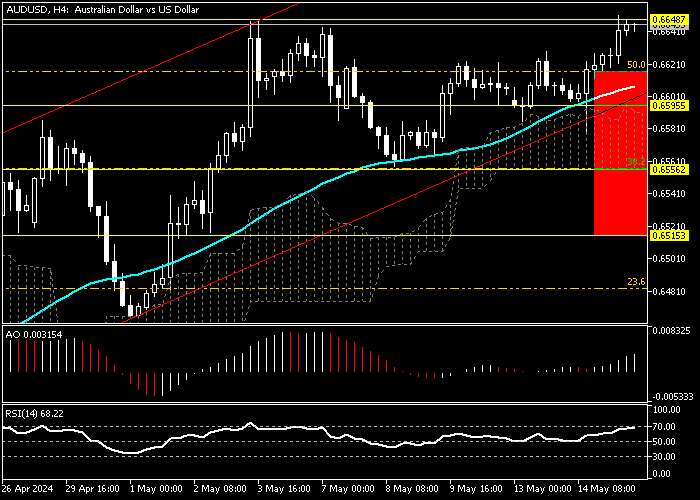
The 4-hour chart above offers more detailed insights into the currency pair’s price action. The image shows the AUDUSD pair trades above EMA 50 and inside the bullish flag. However, the bears have not demonstrated significant momentum since no bearish candlestick pattern has emerged.
Interestingly, the Awesome oscillator also shows a divergence in the bars, which supports the same signal as the daily chart. These developments in the technical indicators make the possibility of a trend reversal even stronger.
AUDUSD Potential Dip to 0.65 and Beyond

As explained in this article, the main trend is bullish, but a bearish outlook is in play for the following data we have from the chart:
- Awesome oscillator signals divergence in both daily and 4-hour chart
- The price bounced three times this year from 0.664 strong resistance.
That said, from a technical standpoint, the AUDUSD might dip to 0.659, followed by 38.2% Fibonacci and the 0.655 mark, which is below EMA 50 and the Ichimoku cloud.
AUDUSD Bullish Scenario

The bulls must close and stabilize the price above the 0.664 key resistance for the uptrend to resume. If this scenario comes into play, the path to the 61.8% Fibonacci ($0.667) will likely be paved. This might drive the RSI into the overbought zone. Therefore, traders and investors should monitor the key resistance levels meticulously.
AUDUSD Key Support and Resistant Levels
- Resistant: $0.664, $0.667
- Support: $0.6595, $0.6515