FxNews – Every forex trader should develop a solid strategy to succeed in trading securities. Therefore, they require the right tools and indicators to create a desirable trading system.
MetaTrader 5 is one of the most popular and widely used trading platforms, well-known for its flexibility and robust features. Numerous indicators exist that assist traders worldwide in their technical analysis. One that stands out is the Auto Trendlines indicator.
The Auto Trendlines indicator is a valuable technical indicator designed to identify trends and highlight potential support and resistance on a MetaTrader 5/4 chart.
In this comprehensive article, we will examine the Auto Trendlines indicator, how it works, and how it can assist traders in unlocking potential in the financial market.
Understanding the Basics of Trends in Forex
Before we go any further, let’s clarify the trend and why it is essential when trading CFD products. When we look at a chart on the MetaTrader platform, we see the market either going up or down.
Sometimes, the market lacks direction and goes sideways. These market movements are called trends. If the market is heading up, the trading instrument is bullish. If the chart direction is running down, that indicates a bearish market.
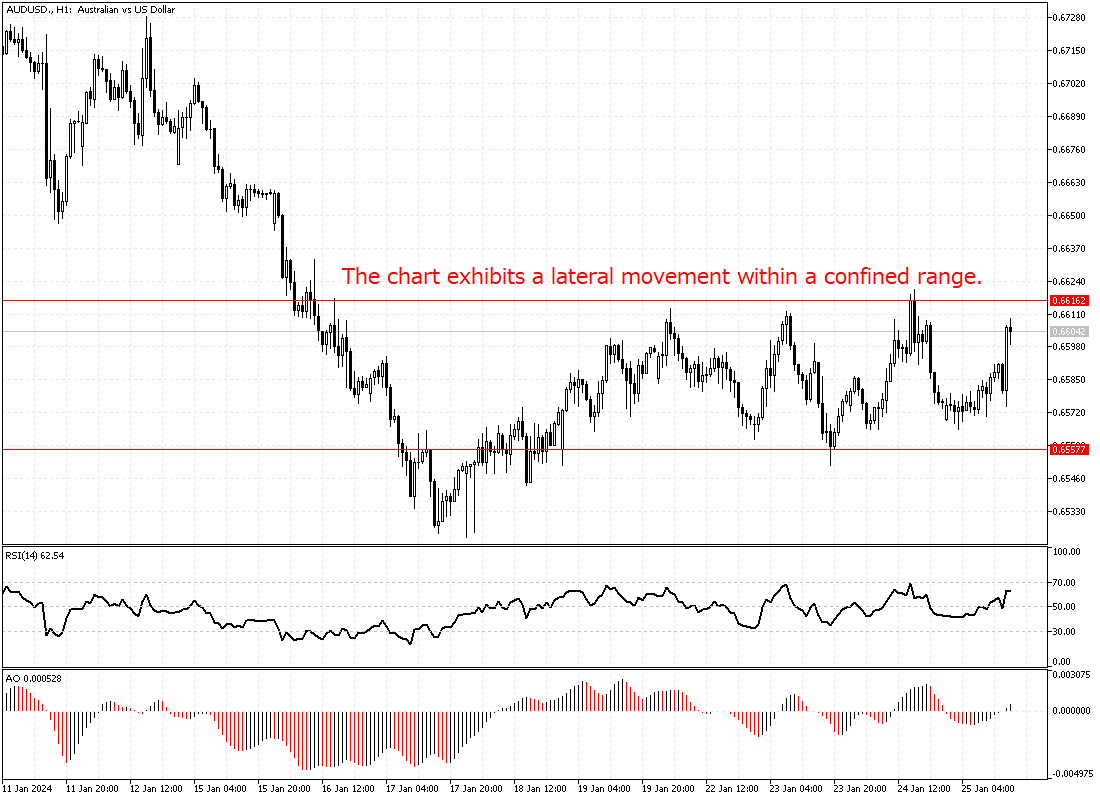
In addition to the upward and downward trend, we have sideways market conditions, which happen when the price moves sideways, usually in a narrow range. The chart below shows a sideway or range market.
What is the Auto Trendlines Indicator
The Auto Trendlines indicator is a technical analysis tool developed to help forex traders find and confirm trends. It can be handy whether the market is trending or moving sideways.
The Auto Trendlines indicator is suitable for traders who use trend-following strategies because it provides valuable insight into the current market condition and potential entry and exit prices on pullbacks and breakouts.
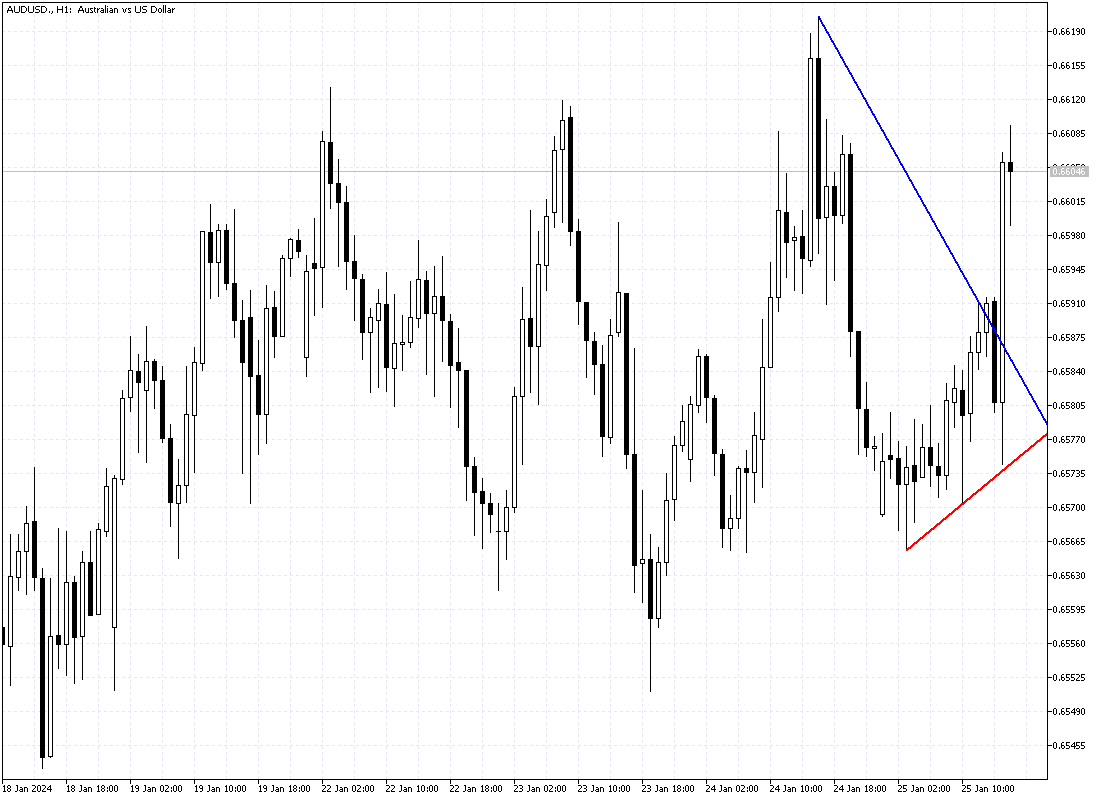
The image below shows the Auto Trendlines indicator performance on sideways market conditions.
Key Features of the Auto TrendLines Indicator
The Auto TrendLines indicator is equipped with a range of features and parameters. In this article, we will go through each one. These features have made this MT5 indicator versatile for trading in the financial market.
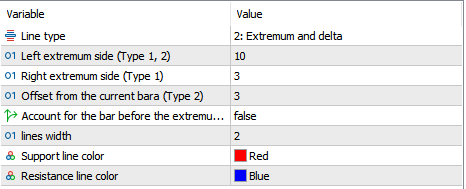
Customizable Periods: The market condition changes over time. Therefore, traders should change indicators’ settings accordingly to match the market behavior. The Auto TrendLines indicators implemented these features in their settings, named left extremum side, right extremum side, and offset from the current bara.
The settings are 10, 3, and 3 by default. However, forex traders can change these parameters to find the best fit. The indicator’s settings are accessed by pressing Control+I and selecting the Auto TrendLines indicator from the list. In the new window, select the ‘input’ tab to access the settings fully.
I changed the “left extremum side” from 10 to 20 to make the indicator collect older data. This way, the indicator draws the trendlines more accurately because it will have more data.

Once we have taught the indicator basics, we will examine how to find the best settings for the Auto TrendLines indicator. So stay with me until the end of the article.
Multi-Timeframe Analysis: The Auto Trendlines indicator can be used on multiple timeframes, which makes it very helpful in identifying the primary trend. Since the main trend can be found in higher time frames such as daily, weekly, and monthly charts, the AutoTrendlines indicator can draw trendlines in any time frame, from one minute to a monthly chart.
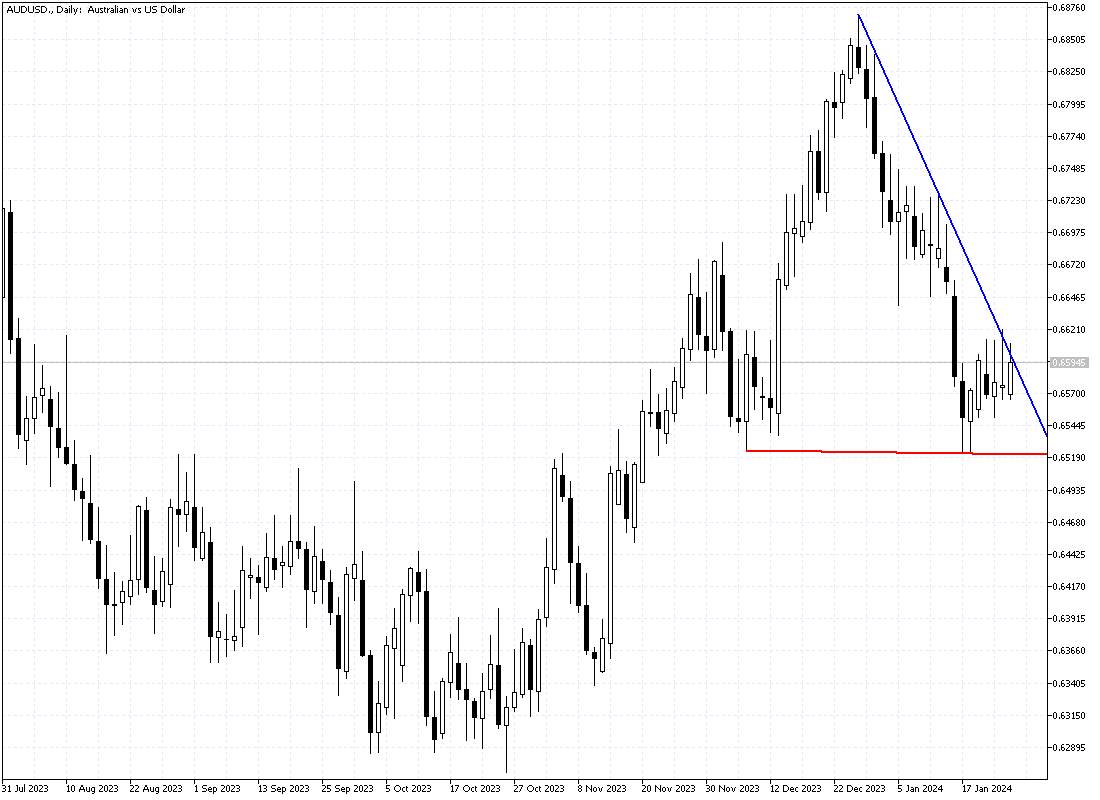
The chart below shows the Auto Trendlines indicator in the AUD/USD daily chart. The Auto Trendlines indicator shows a downtrend market, with the blue trendline heading downward. If the price crosses above the blue line, it can be construed that the bearish trend is weakening, and a trend reversal is on the horizon.
Autotrends indicator signal confirmation: The indicator can confirm trend signals. It accomplishes this task by analyzing multiple timeframes and assessing the trend’s consistency over various timeframes. Regardless of a trend’s direction, a more decisive confirmation can boost traders’ confidence in their trading decisions.
The chart below shows the AUD/USD currency pair in the 1-hour time frame. The bulls crossed above the blue line, which the technical analysis interprets as a breakout. The red line supports the breakout. With the price hovering above the support, the breakout might surge the asset’s price. In this scenario, the first bullish target could be the 0.6619 resistance.

User-Friendly and Easy-to-Use Interface: The AutoTrends indicator has a simple UI and is easy to use. It draws two lines. A blue line is resistance, and a red line is support. Since the indicator is easy to use, it can be a good company for both newbies and experienced traders. However, the Auto TrendLines indicator is a better fit for new traders who might need more experience drawing trendlines on the chart.
Cons: Unfortunately, the Autotrends indicator doesn’t have alerts for when the price touches one of the trendlines. Because of this, traders are required to check the market more often during trading sessions. One way around this issue is to utilize MetaTrader 5’s alert by placing it near the trendlines. It could be better, but it can do the job.
How the Auto TrendLines indicator works
The indicator employs various mathematical calculations and algorithms to draw the trendlines on a chart. While the specific details of the algorithm might depend on the indicator’s version, the general concept remains identical.
Here is a simplified overview of how the Autotrends indicator works on the MetaTrader 5 chart.
Data collection: The indicator collects historical data on the chart and the trading instrument. The collecting period can be changed in the indicator’s settings. Using this data, the indicator can analyze the price movement over a specific time frame.
Trend Identification: The technical indicator uses the collected data to find potential trends within the chart. Autotrends does this by looking for consistent directional movement in the security price.
Trend confirmation: Once the indicator draws the lines, one blue and one red, the direction in which the lines point confirms the trend. If the lines point upward, the market is bullish, and vice versa.
Using the AutoTrends indicator in a Real Market
You have learned the basics of the Auto Trendlines indicator so far; now, it is time to learn how to use it effectively in the real market. As mentioned earlier, the Auto Trendlines indicator fits trend-following strategies. Therefore, it must be utilized accordingly. The market is bullish when the indicator lines show an uptrend; hence, traders should look for buying opportunities.
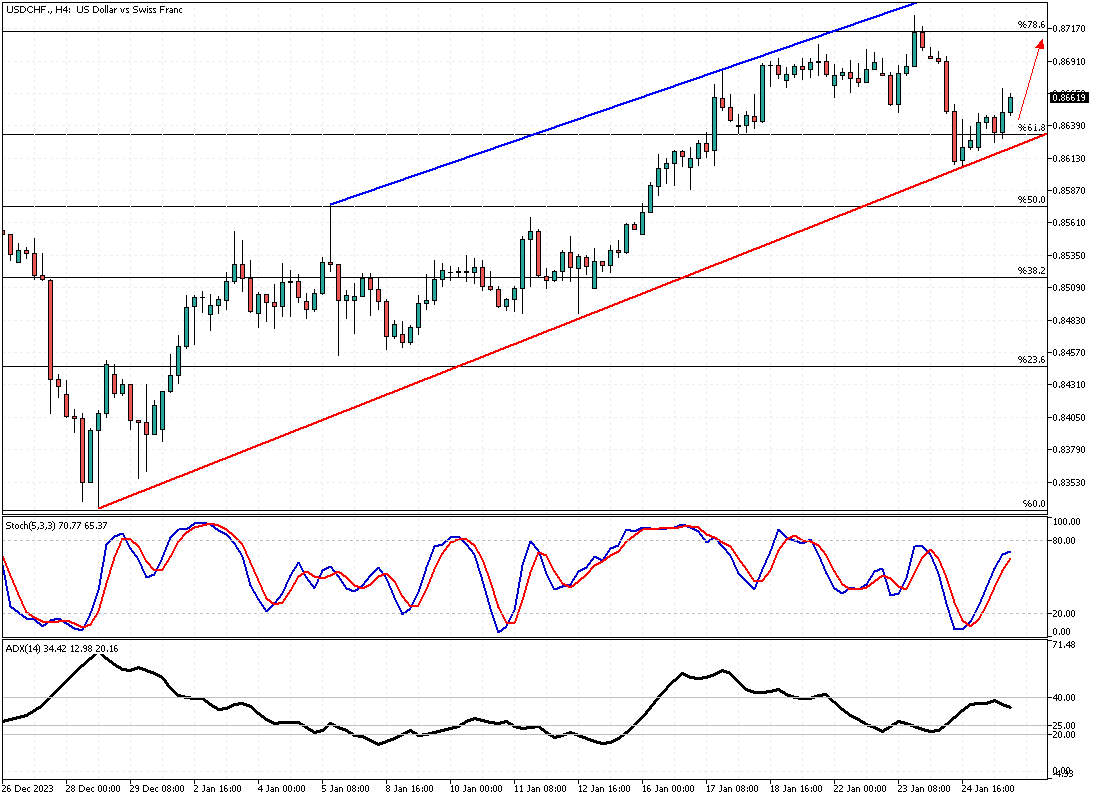
Example: The image below shows the USD/CHF chart in the 4-hour timeframe. The blue and red trendlines point to an upside parallel channel, indicating a bullish market.
Mixing the Auto Trendlines indicator with the Stochastic oscillator and the Fibonacci retracement tool helped me find the oversold area near the 61.8% level. For a bullish scenario, the USD/CHF price must remain above the red trendline. In this case, the uptrend market should extend with the 78.6% Fibonacci resistance level as its first target.
Decoding the Signals of Automated Trendlines Indicator
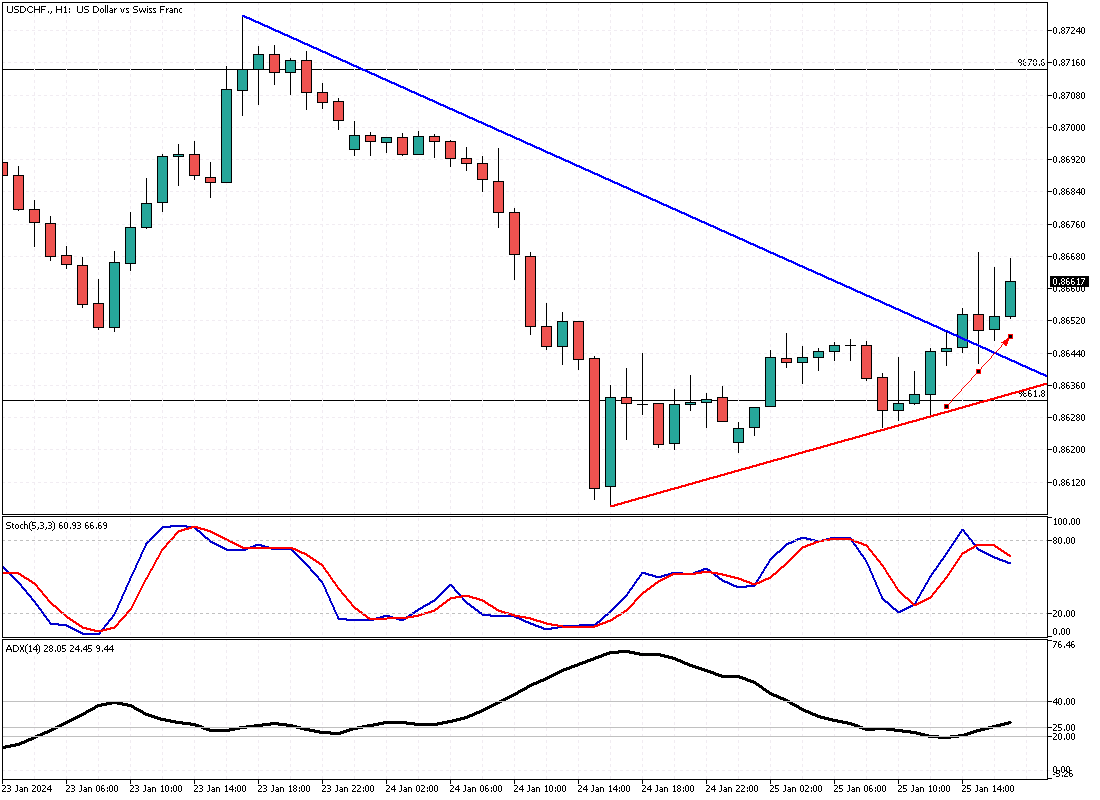
1 – Pullbacks: If the price touches the lower line or the upper line of the auto trends indicator, it can be interpreted as a pullback could be imminent. Mixing the AutoTrendlines wisely with other technical tools, such as a Stochastic Oscillator or RSI, can assist traders in spotting potential resistance levels for a pullback.
The oscillators mentioned can demonstrate an overbought and oversold market. Please note that the possibility of a pullback increases with saturated market conditions.
The USD/CHF chart below demonstrates a pullback in the 1-hour time frame once the price touched the red line.
2 – Breakouts: Breakouts are as popular as the pullback strategies. Luckily, traders can find breakouts with the assistance of the autotrends indicator. It is a straightforward trading system about a significant price movement in the financial market.
With the AutoTrends indicator, we can find the critical trendlines on the chart. A breakout is when the price crosses these lines from below or above. Let’s say the price of Silver crosses above the AutoTrends’ blue line. This movement in the market is interpreted as the previous trend is over or weakening. Therefore, traders can optimize their strategies by seeking buying opportunities.
The chart below shows the Silver price in the 4-hour chart. If the XAG/USD price crosses above the blue line, the uptrend should extend to higher levels of resistance.

Risk Management: Support and resistance are the most popular methods to find where to stop a loss or profit. Traders should be able to manage their losses and gains to succeed in forex trading, and the Autotrends indicator can help trades achieve this importance.
Please take the chart below as an instance. Traders can use the lower line of the indicator to set the stop loss point and the upper line to put their take profits. Suppose the market breaches the lower line of the indicator. That can be interpreted as the current market trend no longer valid, and the previous technical analysis should be invalidated.
Conversely, suppose the currency pair’s price increases and reaches the take-profit price. In that case, the order will be closed in profit, and traders can wait for the next opportunity to enter the market.

The Best for the Auto Trendlines Indicator
The indicator can be used in any time frame. However, it is essential to understand how the timeframes work. Generally, technical indicators perform better in higher time frames, such as the 1-hour and 4-hour periods. Traders should inspect the market directions on the daily and 4-hour charts and then look at a more petite time frame, such as 1-hour, to find a decent entry point.
Conclusion
The Auto Trendlines indicator helps traders easily find the market direction by dragging and dropping it into a forex chart. The indicator automatically analyzes the prices’ highs and lows on the chart and draws support and resistance in the form of trendlines.
Another advantage of the indicator is its easy setup and integration on MT5 and MT4 platforms. That said, the indicator is free to use. However, as with any forex technical tool, the Auto Trendlines indicator and other tools and techniques should be used wisely.
I am J.J. Edwards, and I wish you safe and successful trading.