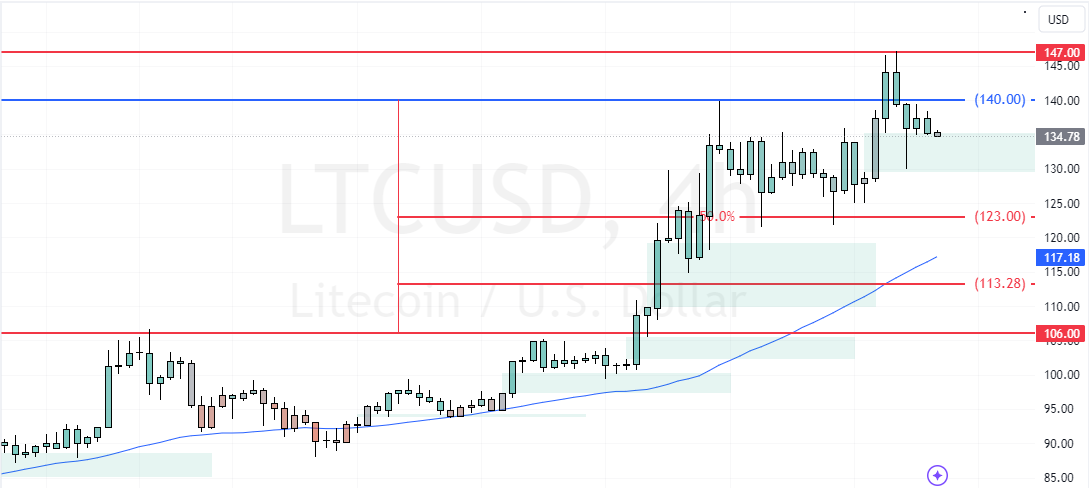
FxNews—Litecoin surpassed the $140.0 peak on December 4 with a strong bullish candle. However, the momentum did not last long, and the prices flipped below the 140.0 mark. Later that day, the downtrend eased after the market tested the bullish fair value gap area at $130.0.
As of this writing, LTC/USD trades at approximately $135.0, trying to resume its bullish trajectory.

Litecoin Technical Analysis
On the technical front, Litcoin’s primary trend should be considered bullish as long as the crypto trades are above the 100-period simple moving average or the $113.0 support. That said, the immediate resistance rests at $140.0.

From a technical perspective, the current consolidation phase could extend to $123.0, below the immediate resistance. This strategy is likely because the RSI 14 has hinted at a bearish divergence since early December.
- Also read: XRP Below $3.0 Amid Stronger Bearish Signals
Conversely, the uptrend could resume if bulls pull Litecoin prices above the $140.0 mark. If this scenario unfolds, the next bullish target could be the $150.0 mark.