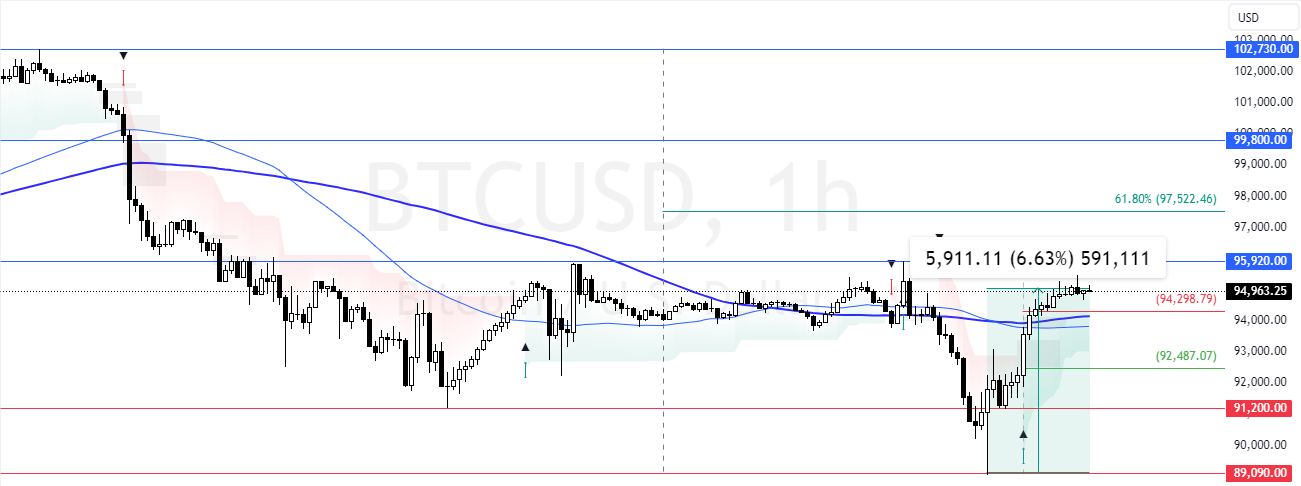
Bitcoin is up 6.6% after bears failed to maintain prices below $91,200. If bulls pull the prices above the immediate resistance of $95,920, the current bullish momentum could extend to $97,500.

Bitcoin Technical Analysis – 14-January-2025
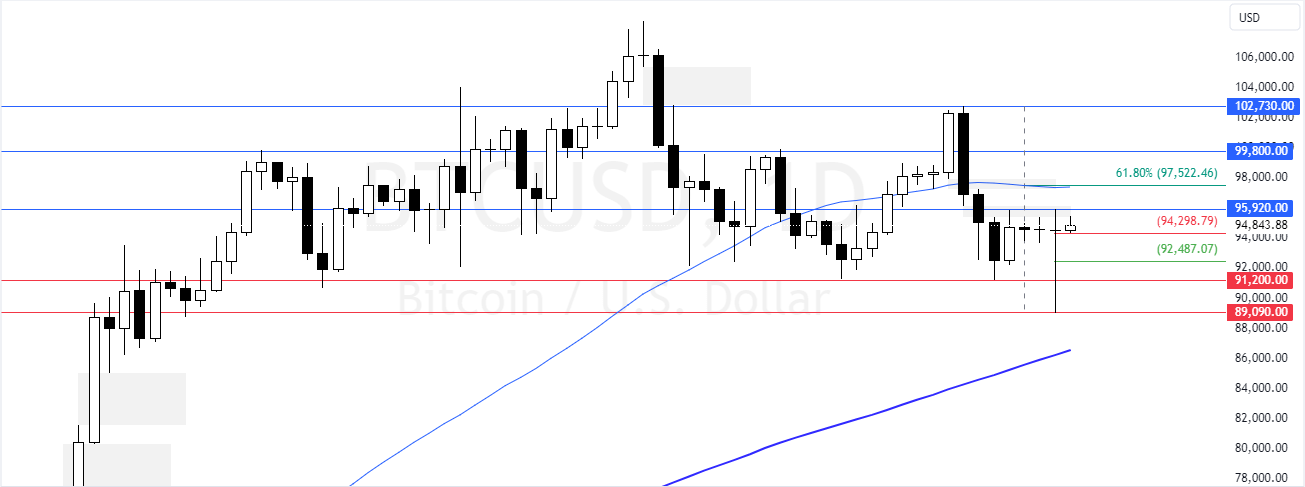
FxNews—Bitcoin has been in a bear market, below the 50- and 100-period simple moving average and has lost 7.4% of its value since January 7. However, the selling pressure eased at $89,090.
As of this writing, BTC/USD trades at approximately $95,000, testing the 100-period simple moving average as resistance.

What Do Technical Indicators Reveal?
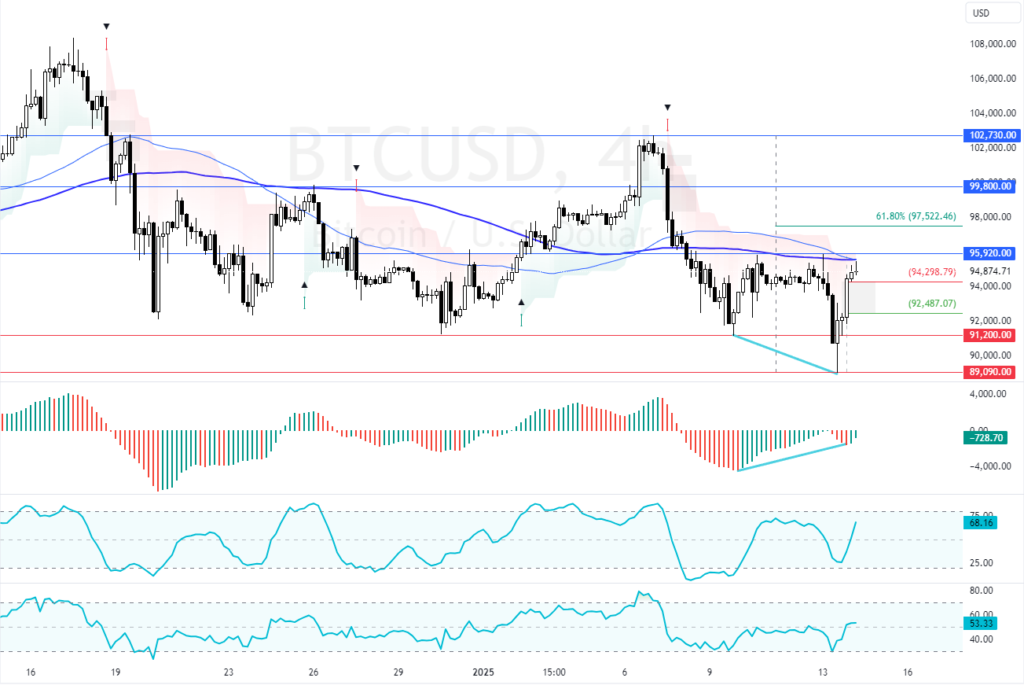
- The RSI 14 value is 54.0, above the median line. This means the bull market strengthened.
- The Stochastic Oscillator value is 68.0, indicating that the market is not overbought and that the uptick in momentum could resume.
- The Awesome Oscillator histogram is green below zero, but it also signals divergence. This could indicate a trend reversal or a consolidation phase on the horizon.
Overall, the technical indicators suggest that while the primary trend is Bearish, Bitcoion has the potential to rise toward upper resistance levels.
Bitcoin is up 6.6% Amid Divergence Signals: What’s Next?

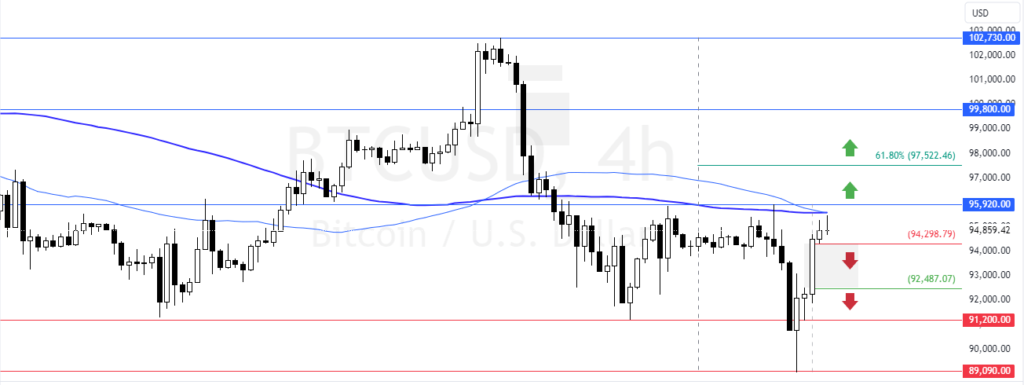
The immediate resistance is at $95,920. From a technical perspective, the bullish wave from $89,090 could extend to higher resistance levels if the prices exceed $95,920. In this scenario, the next bullish target could be the 61.8% Fibonacci at $97,500, followed by $99,800.
Please note that the bullish outlook should be invalidated if BTC/USD falls below $94,300.
The Bearish Scenario
The immediate support is at $94,300. From a technical standpoint, the downtrend will likely resume if the value of BTC/USD falls below $94,300. If this scenario unfolds, the next bearish target could be $92,480, followed by $91,200.
Please note that the Bitcoin trend outlook remains bearish as long as the prices are below the 100-period simple moving average or the $95,9200 resistance.
Bitcoin Support and Resistance Levels – 14-January-2025

Traders and investors should closely monitor the BTC/USD key levels below to make informed decisions and adjust their strategies accordingly as market conditions shift.
| Bitcoin Support and Resistance Levels – 14-January-2025 | |||
|---|---|---|---|
| Support | $94,300 | $92,480 | $91,200 |
| Resistance | $95,920 | $97,500 | $99,800 |