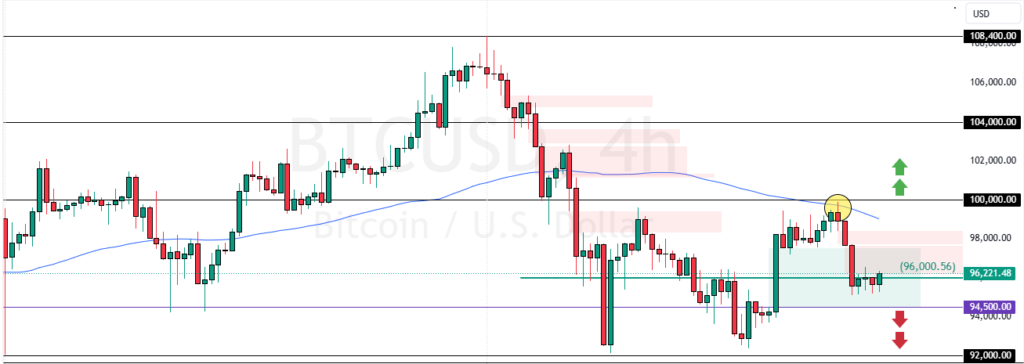
Bitcoin Stayed Below $100K resistance, trading bearish below the 75-period SMA. This decline was anticipated due to the Stochastic’s overbought signal on December 24.
A Dip below the immediate support at $94,500 can trigger the downtrend, targeting $92,000.
Bitcoin Technical Analysis – 27-December-2024
BTC/USD is trading bearish, below the 75-period simple moving average. As for other technical indicators, the Awesome Oscillator histogram is red, below the signal line. Additionally, the RSI 14 and Stochastic depict 46 and 27 in the description, meaning the market is not oversold, and the downtrend could resume.
As of this writing, Bitcoin trades at approximately $96,260, pulling away from the $94,500 immediate support backed by the bullish fair value gap.
Overall, the technical indicators suggest that while the primary trend is bullish, the Bitcoin bears need to close below $94,500 for the dwontrend to resume.
Watch Bitcoin Drop to Potential $92,500 Target
The immediate support is at $94,500. From a technical perspective, the downtrend could extend to lower support levels if bears (sellers) push BTC/USD below $94,500.
If this scenario unfolds, the next bearish target could be $92,500.
- Bitcoin Analysis: Technical, Fundamental & News

- Litecoin Gained 7.1%: What’s the Next Target?

- Bitcoin is up 6.6% Amid Divergence Signals: What’s Next?

The Bullish Scenario
The immediate resistance is at $100,000. From a technical perspective, the uptrend will likely resume if the Bitcoin value exceeds $100,000. In this scenario, the bullish wave from $92,000 could extend to $104,000, followed by $108,400.
Bitcoin Support and Resistance Levels – 27-December-2024
Traders and investors should closely monitor the Bitcoin key levels below to make informed decisions and adjust their strategies accordingly as market conditions shift.
| BTC/USD Support and Resistance Levels – 27-December-2024 | |||
|---|---|---|---|
| Support | $94,500 | $92,000 | $90,000 |
| Resistance | $100,000 | $104,000 | $108,000 |


