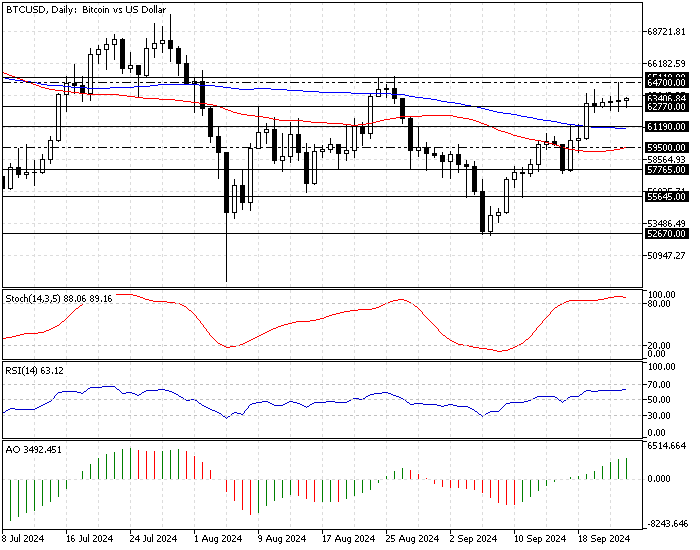
FxMews—Bitcoin’s uptrend eased when the price neared the August high of around $65,000. As of this writing, the digital gold is testing the August 9 high at $62,770, trading at approximately $63,400.
The daily chart below demonstrates the price, support, resistance levels, and technical indicators used in today’s analysis.

Bitcoin Technical Analysis – 24-September-2024

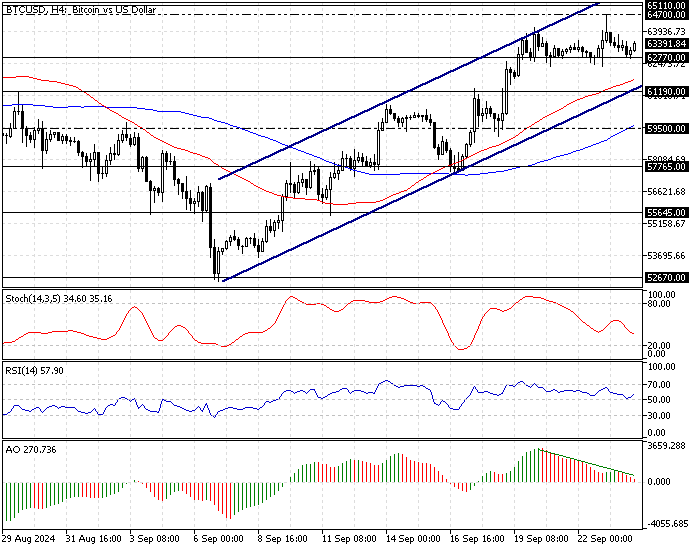
The Awesome Oscillator indicator signals divergence in the 4-hour chart, which suggests a possible consolidation phase. Meanwhile, the stochastic oscillator is dipping, showing 34 in the description, meaning the bear market is gaining momentum.
On the other hand, the primary trend is considered bullish because the BTC/USD price is above the 50- and 100-period simple moving averages.

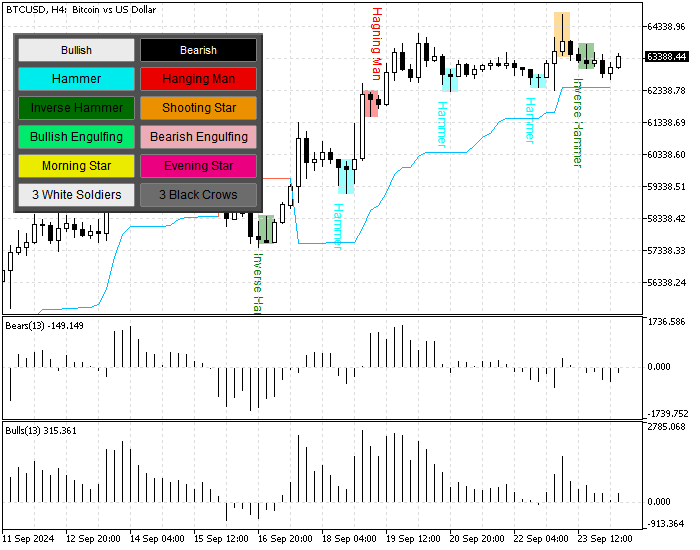
Additionally, Bitcoin’s price is above the supertrend indicator, another sign of a robust bull market.
Overall, the technical indicators suggest Bitcoin is in an uptrend, but it could consolidate near the lower support levels before the uptrend resumes.
Bitcoin Forecast – 24-September-2024
The immediate resistance lies at $62,770. If the Bitcoin price dips below this level, the consolidation phase that began yesterday could extend to $61,190. This level provides a decent bid for retail traders to join the bull market at a dip.
Therefore, traders and investors should closely monitor the $61,190 level for bullish candlestick patterns, such as bullish engulfing or hammer candlestick patterns.
Please note that the 50-period SMA is the primary support for the bullish strategy. The bull market should be invalidated if Bitcoin’s value dips below the 100-SMA.
Bitcoin Bearish Scenario – 24-September-2024
The critical support level for the current bull market is $61,190 (September 17 High), coinciding with the 50-period simple moving average. If the BTC/USD price crosses below $61,190, the trend should be considered bearish.
If this scenario unfolds, the Bitcoin decline could extend to the 100-period simple moving average of approximately $59,500, neighbors the September 18 low.
Bitcoin Support and Resistance Level – 24-September-2024
Traders and investors should closely monitor the key levels below to make informed decisions and adjust their strategies accordingly as market conditions shift.
- Support: $62,770 / $61,190 / $59,500
- Resistance: $65,110 / $66,000 / $67,000