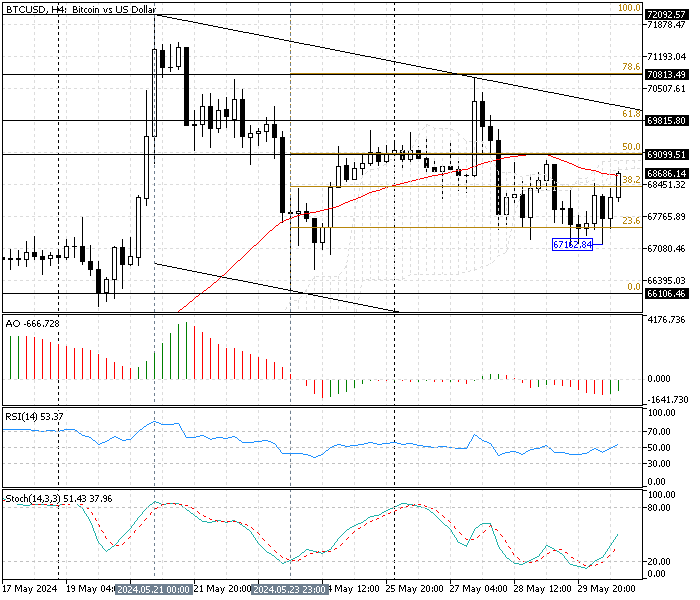
Bitcoin has been trading sideways since May 23, and as of this writing, it is worth about $68,390. The BTC/USD 4-hour chart below shows the cryptocurrency pair making higher lows, trading below the descending trendline. This week, the price dipped below SMA 50 and Ichimoku Cloud. This means the consolidation phase that began on May 21 might continue to lower support levels.

The technical indicators in the 4-hour chart give the following information and signals:
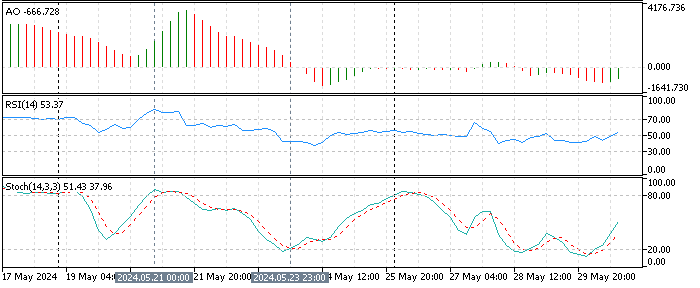
- The awesome oscillator bars are below zero and green, demonstrating -693 in the description and signaling divergence. These developments in the awesome oscillators indicate the trend has bullish tendencies, and the momentum might increase soon.
- The relative strength index indicator value is 48, moving horizontally alongside the middle line, indicating the Bitcoin market lacks momentum.
- The stochastic value is 42, floating in the middle, which indicates that the market is not oversold or overbought, meaning it has low momentum.

These developments in the technical indicators in the BTC/USD 4-hour chart suggest the market is ranging sideways and showing signs of uncertainty. However, since the price is below the simple moving average (50) and the Ichimoku cloud, we consider the market to have bearish tendencies.
Bitcoin Market Forecast – May-30-2024

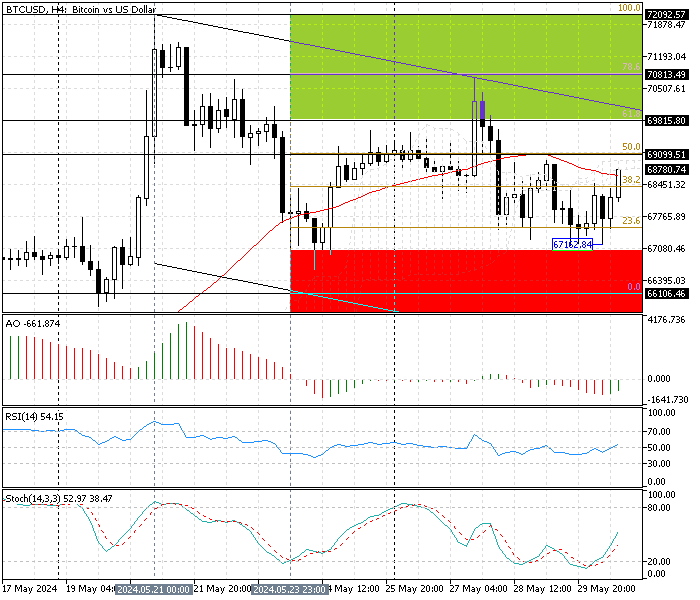
Bitcoin’s primary support is the 38.2% Fibonacci level at $67,162. If the price dips below this immediate support, the downtrend initiated from 78.6% Fibonacci will likely target the May 23 low at $66,106, followed by the lower line of the bearish flag at $64,900.
The bearish scenario remains valid if the Bitcoin price is below the critical resistance level at $69,815, backed by the descending trendline.
Bullish scenario
The Bitcoin primary trend is bullish. For the uptrend to resume, the bulls must cross above the 61.8% Fibonacci level at $69,815. If this scenario unfolds, the next bullish target should be at May’s all-time high of $72,092, followed by the April 8 high of $72,879.
Bitcoin Key Support and Resistance Levels
Traders and investors should closely monitor the BTC/USD key levels below to make informed decisions and adjust their strategies accordingly as market conditions shift.
- Support: $67,162 / $66,106 / $64,900
- Resistance: $69,099 / $69,815 / $70,813 / $72,092