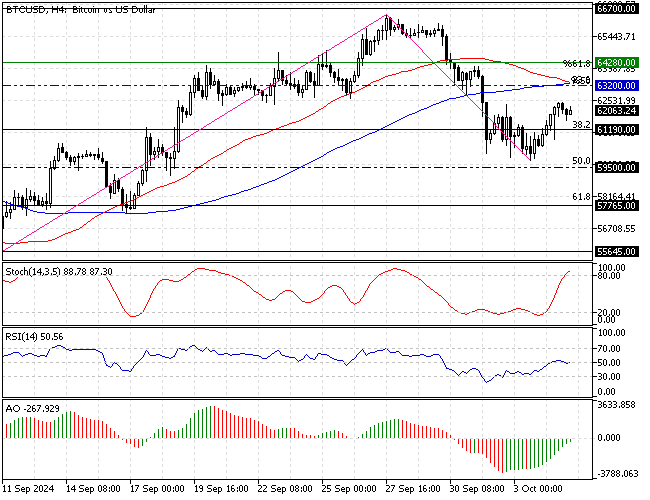
FxNews—The Bitcoin price is experiencing a pullback from the %50 Fibonacci retracement level ($59,500), trading above the %38.2 Fibonacci at approximately $62,000 as of this writing.
Notably, the BTC/USD pair’s primary trend is bearish because the digital gold price is below the 100-period simple moving average. The 4-hour chart below demonstrates the price, support, resistance levels, and technical indicators utilized in today’s analysis.

Bitcoin Technical Analysis – The $63000 Pivot Explained
The bullish wave from the $59,500 mark resulted in the Stochastic oscillator stepping into overbought territory, signaling a saturated market. Meanwhile, the Awesome oscillator histogram neared the signal line with green bars, indicating the bulls are adding more bids to Bitcoin’s price.
- Additionally, the RSI 14 indicator depicts 50 in the description, meaning the bull market is gaining more momentum.

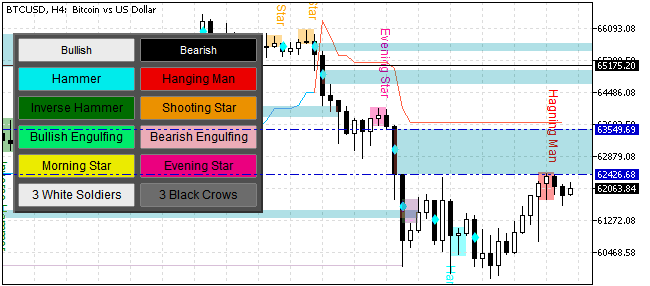
As for the candlestick pattern, the 4-hour chart formed a “hanging man” candlestick, signaling that a bear market might initiate soon. Furthermore, the bearish “hanging man” candlestick pattern is near the “fair value gap,” making it a vital point for price reversal.
Overall, the technical indicators suggest the current uptick momentum should resume, but the price action and candlestick patterns warn that the trend could reverse.
Bitcoin Price Forecast – 5-October-2024

The critical pivot/resistance point is at the $63,200 mark, a demand zone backed by the 50% Fibonacci retracement level from the B-C leg and the 38.6% level from the A-B leg.
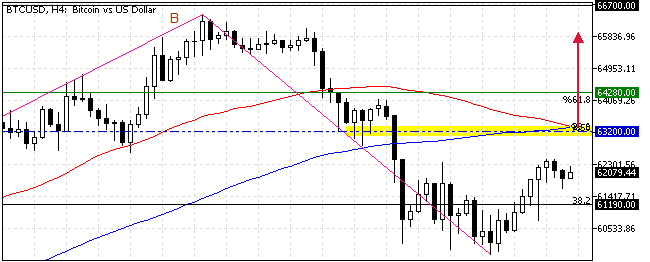
The outlook for Bitcoin’s trend remains bearish as long as it trades below the $63,200 mark. However, due to the bullish signals received from the technical indicators, the price can potentially increase and test the $63,200 pivot/resistance mark, backed by the 100-period SMA.
If this scenario unfolds, the bulls will also fill the “fair value gap” area, which has expanded from $62,426 to $63,549.
Traders and investors should monitor the critical pivot point closely for bearish signals, such as a bearish engulfing pattern or a long wick candlestick pattern, as a confirmation before joining the bear market. In the bearish scenario, the price can potentially reverse from $63,200 and aim to revisit the $59,500 support.
Bitcoin Bullish Scenario – 5-October-2024

Please note that the bear market should be invalidated if Bitcoin bulls cross and stabilize above the $63,200 mark. If this scenario unfolds, the bull’s patch to the September 2024 high at $66,700 will likely be paved.
Bitcoin Support and Resistance Levels – 5-October-2024
Traders and investors should closely monitor the key levels below to make informed decisions and adjust their strategies accordingly as market conditions shift.
- Support: $61,190 / $59,500 / $57,765
- Resistance: $63,200 / $64,280 / $66,700