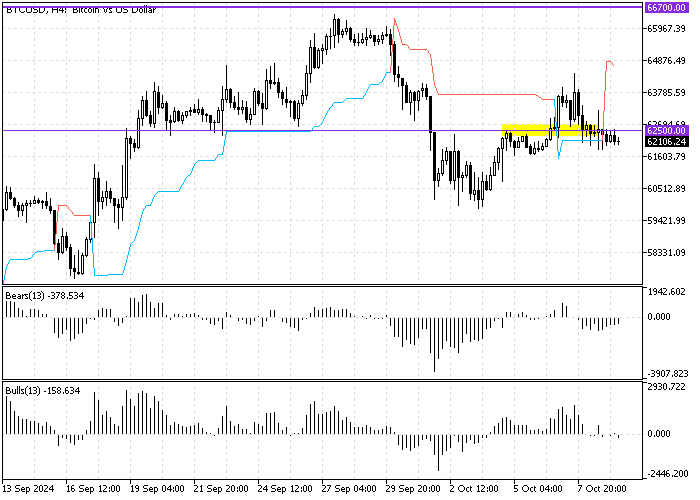
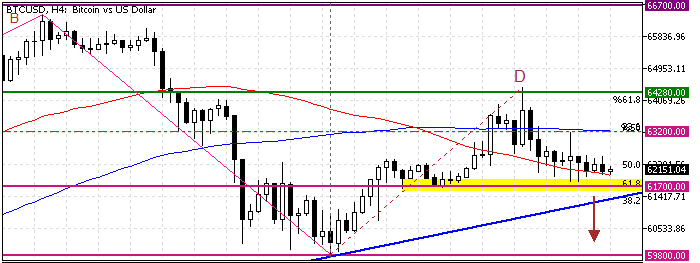
FxNews—Bitcoin trades bearish from $64,280, testing the CD wave’s 61.8% Fibonacci retracement level at $61.700. The BTC/USD 4-hour chart below demonstrates the price, support, resistance levels, and technical indicators utilized in today’s analysis.

Bitcoin Technical Analysis – 9-October-2024

Bitcoin’s primary trend should be bearish because the price is below the 100-period simple moving average. Additionally, the Awesome oscillator histogram flipped below the signal line, signifying a strengthening bear market.
Additionally, the Stochastic oscillator stepped into the oversold territory, depicting 17 in the description, meaning Bitcoin is oversold, and the price can bounce from this point.
- The relative strength index also supports the bear market but is below the median line, recording 46 in the description.

In addition to the momentum technical tools, the price flipped below the Supertrend line, signaling a sell market.
Overall, the technical indicators suggest that Bitcoin’s primary trend is bearish, and the price can decline to lower support levels.
Bitcoin Price Forecast 9-October-2024

The critical resistance of the AB bullish wave is the 61.8% Fibonacci retracement level, which lies at $61.700. If bears close and stabilize BTC/USD below the 61.8% Fibonacci, the current bearish momentum from $64,280 will likely spread to $59,800.
The 100-period simple moving average is the critical resistance to the bearish strategy. If Bitcoin’s price exceeds the 100-SMA, the downtrend strategy should be invalidated.
Bitcoin Bullish Scenario – 9-October-2024

The candlestick patterns in the 4-hour chart show that the market lacks momentum. That said, the key resistance level is maintained at the 100-period SMA. If Bitcoin bulls pull the price above the 100-SMA, which neighbors the BC bearish wave %50 Fibonacci retracement level at approximately $63,200, a new bullish wave will likely be initiated.
Please note that the bull market should be invalidated if the BTC/USD price dips below the ascending trendline or the $61,700 mark.
Bitcoin Support and Resistance Levels – 9-October-2024
Traders and investors should closely monitor the key levels below to make informed decisions and adjust their strategies accordingly as market conditions shift.
- Support: $61,700 / $59,800 / $57,765
- Resistance: $63,200 / $64,280 / $66,700