In our comprehensive BTCUSD market analysis, we delve into the latest developments in the cryptocurrency landscape and examine Bitcoin’s chart dynamics in depth. We aim to provide you with a clear understanding of current market trends and potential future trajectories. Stay tuned for insightful observations and detailed chart interpretations.
BTCUSD Market Analysis – 155B Boost with ETF Approval
CryptoQuant, a blockchain analytics company, forecasts a $155 billion increase in Bitcoin’s market cap if the ETFs are approved.
Should the Bitcoin spot exchange-traded funds (ETFs) receive approval, Bitcoin’s worth could skyrocket to $900 billion, and the entire crypto market could grow to $1 trillion, according to a recent report by CryptoQuant.
The initial wave of institutional adoption in 2020-2021 saw institutions incorporating Bitcoin into their balance sheets. The upcoming wave might see these institutions offering their clients access to Bitcoin via spot ETFs, as suggested by CryptoQuant. Numerous leading financial institutions have submitted applications to launch spot Bitcoin ETFs in the U.S., with potential approvals expected by March 2024.
Spot ETFs Expected to Outpace GBTC in Next Bull Cycle
The anticipated influx from spot ETFs is predicted to surpass the funds that entered the Grayscale Bitcoin Trust (GBTC) during the last bull market cycle. GBTC, currently managing $16.7 billion in assets, is the world’s largest cryptocurrency fund. Grayscale and CoinDesk are both subsidiaries of the Digital Currency Group.
CryptoQuant estimates that if the applicants for Bitcoin ETF listings allocate 1% of their Assets Under Management (AUM) to these ETFs, around $155 billion could flow into the Bitcoin market. This amount equates to nearly one-third of Bitcoin’s current market cap and could potentially drive Bitcoin’s price to range between $50,000 and $73,000.
Bitcoin’s Market Cap Multiplies in Bull Runs
Bitcoin’s market cap has historically expanded 3-5 times more during bull markets than its realized cap. This indicates that for every dollar of new money entering the Bitcoin market, the market cap could grow by $3-$5.
Bitcoin recently experienced a brief surge to $30,000 following a false report by Cointelegraph about a spot Bitcoin ETF approval. Some observers believe this bullish price action could deter bears for a while. “No one will dare to short BTC now for the foreseeable future. Even if this Cointelegraph news was false, BTC could still grind higher in anticipation of the approval,” said Markus Thielen, head of research and strategy at Matrixport.
The bullish sentiment is further reinforced by the continued reduction of the GBTC discount to its lowest in nearly two years.
BTCUSD Technical Analysis
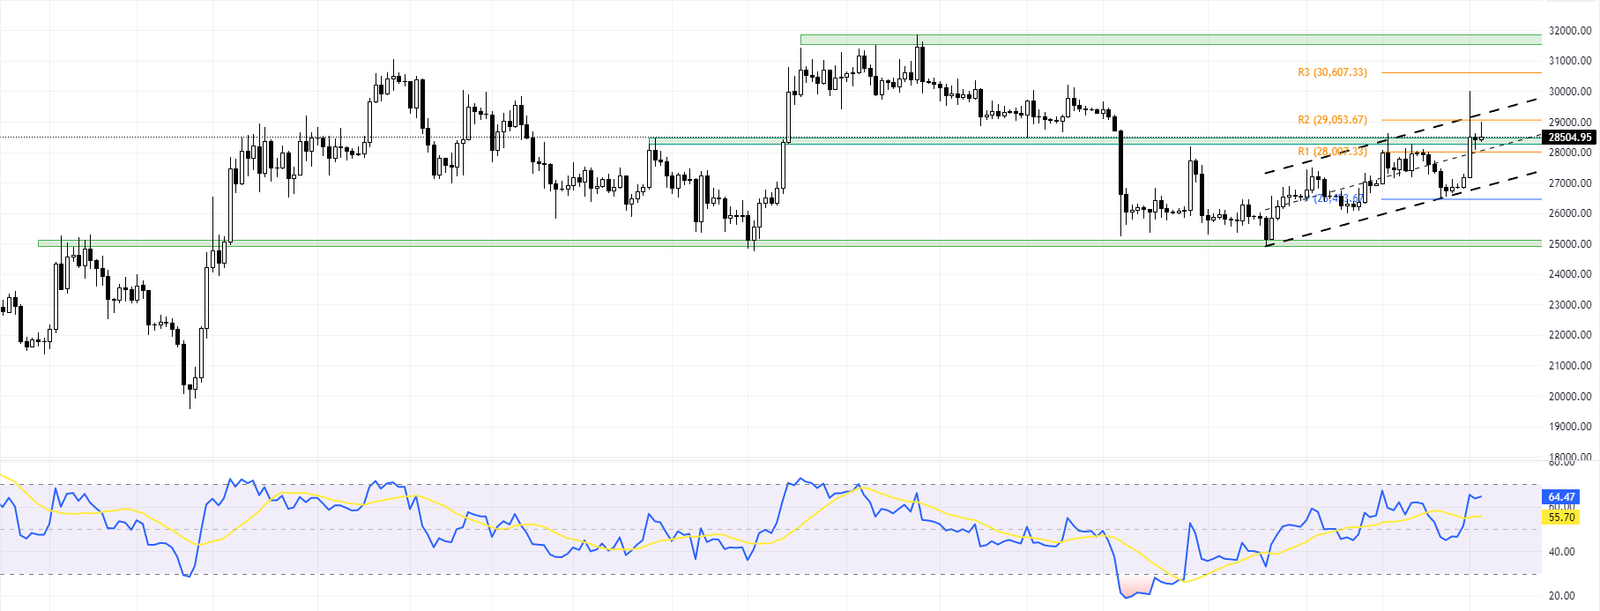
Our latest BTCUSD analysis shows that Bitcoin is breaking through the $28,000 threshold. This significant level has maintained the Bitcoin price from $28,000 to $25,000 since mid-August 2023.

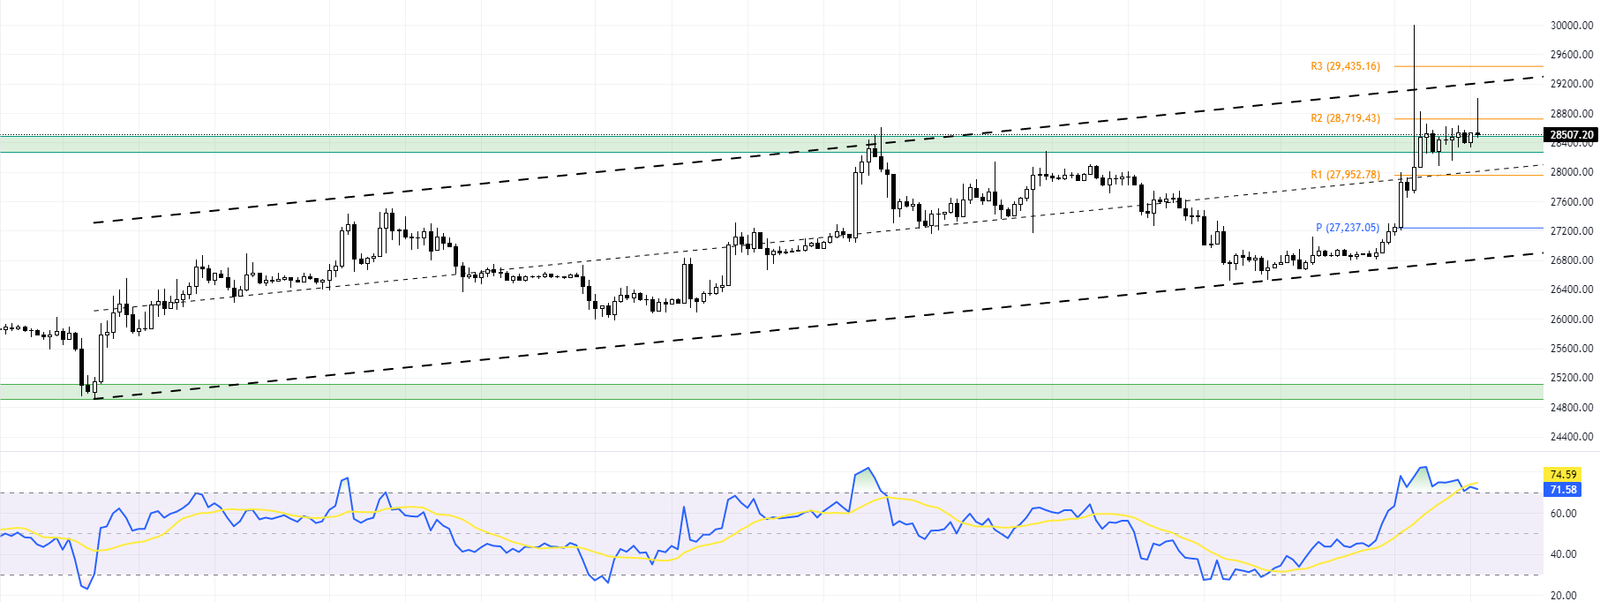
When we delve into the 4-hour chart of BTCUSD, it’s evident that the digital gold is trading within a bullish channel. However, the Relative Strength Index (RSI) indicator is currently overbought. The critical level that sustains the bullish trend of BTCUSD is $27,952. If the price remains above this level, Bitcoin can trade above the bullish channel’s median line.

Given that the RSI is lingering in the overbought territory and the long wick candlestick pattern from the last trading session, we anticipate a minor decline to the R1 level, which presents an attractive supply zone for BTCUSD bulls.
If the R1 level breaks, the next bearish target for the bulls is the $27,237 pivot, followed by the lower boundary of the bullish channel.
Key Levels to Watch
Key levels are crucial in BTC-USD market analysis, providing significant insights into BitcoBitcoin’s initial price movements. These levels, which include support and resistance points, pivot points, and psychological levels, serve as markers for traders to understand market sentiment and make informed decisions.
- Pivot: $27,237
- Support: 27,952
- Resistance: $29,435
By identifying these key levels, traders can anticipate possible price reactions and adjust their strategies accordingly. Therefore, a comprehensive BTCUSD market analysis always thoroughly examines these key levels.