This short article delves into the BTCUSD technical analysis, providing insights into the key trends, potential price movements, and market indicators that traders should know.

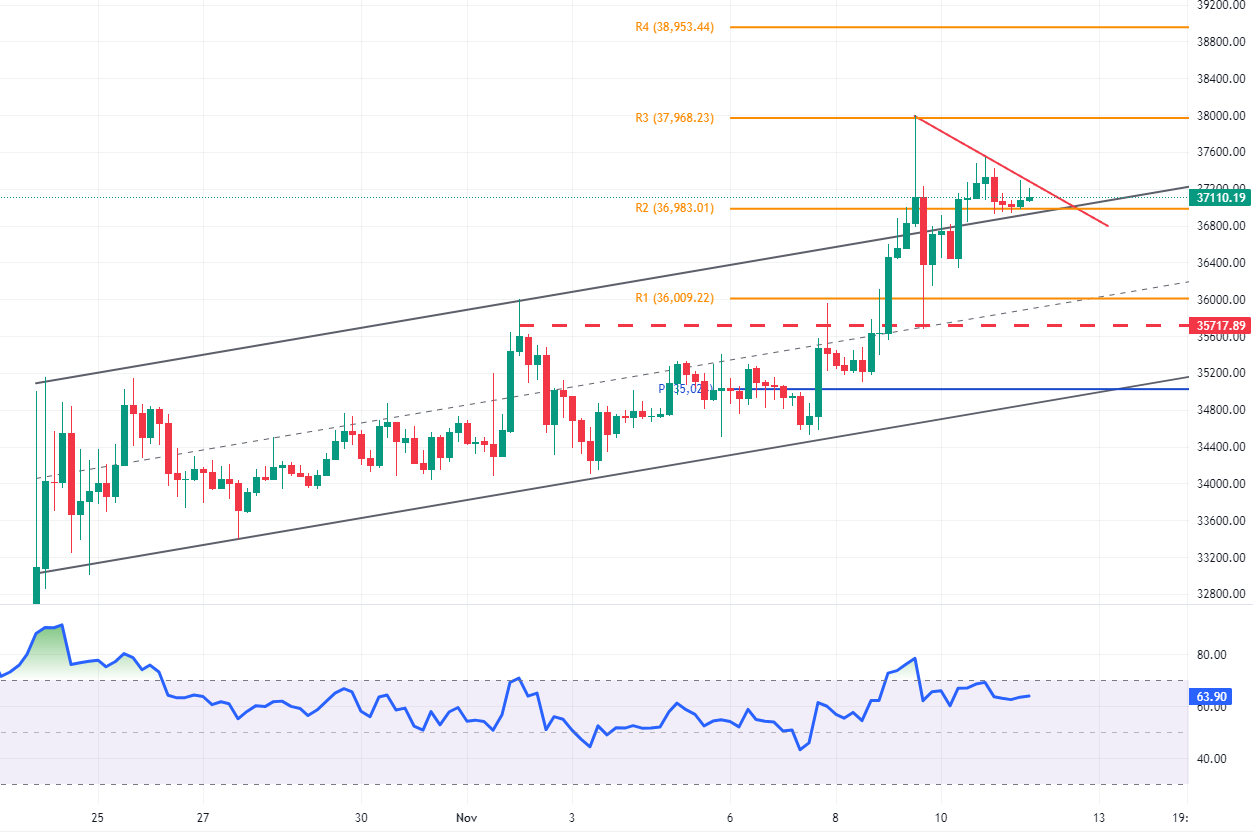
Bitcoin managed to break out of the bullish channel in the 4-hour chart. The BTCUSD pair is currently testing R2 ($36,983 support), with the RSI nearing the overbought area. In the 4-hour chart, we spot an inverted hammer, which can be a signal for bearish momentum. However, the bitcoin market is bullish, and analysts at FxNews suggest waiting for the price to break the bearish trendline (shown in red) to go long.
On the other hand, while the price is trading below the weak bearish trendline (shown in red), the BTCUSD price could decline to R1 ($36,009 support) if the bears close below R2. The R1 level also provides a decent supply for the bulls to trigger news bullish trades.
In conclusion, the Bitcoin market is bullish, and it is better to wait for buying opportunities than bidding on sell orders.